Tokio and Rayon Clash, PostHog Cuts Rust Latency Spikes 4x
Tokio plus Rayon looked like a win until PostHog’s p99s jumped to 2.5 seconds. The fix shows how CFS throttling, not the database, can wreck a hot Rust path.
Feature flags do not forgive a slow path. In PostHog’s Rust rewrite, the service got up to 10.6x faster, then p99 latency began blowing up again as traffic doubled, and the team had to untangle a classic Rust performance trap: async I/O and CPU-heavy parallelism fighting for the same cores.
When the fast path starts stalling
PostHog’s feature flag service sits in the hottest possible place in the product. A slow flag evaluation can stall a customer’s application, so every extra millisecond matters. That is why the company moved off Django in the first place. The old service was handling about 500,000 requests per minute, needed 300 pods, and cost around $8,000 per month in compute, even before reliability started to fray.
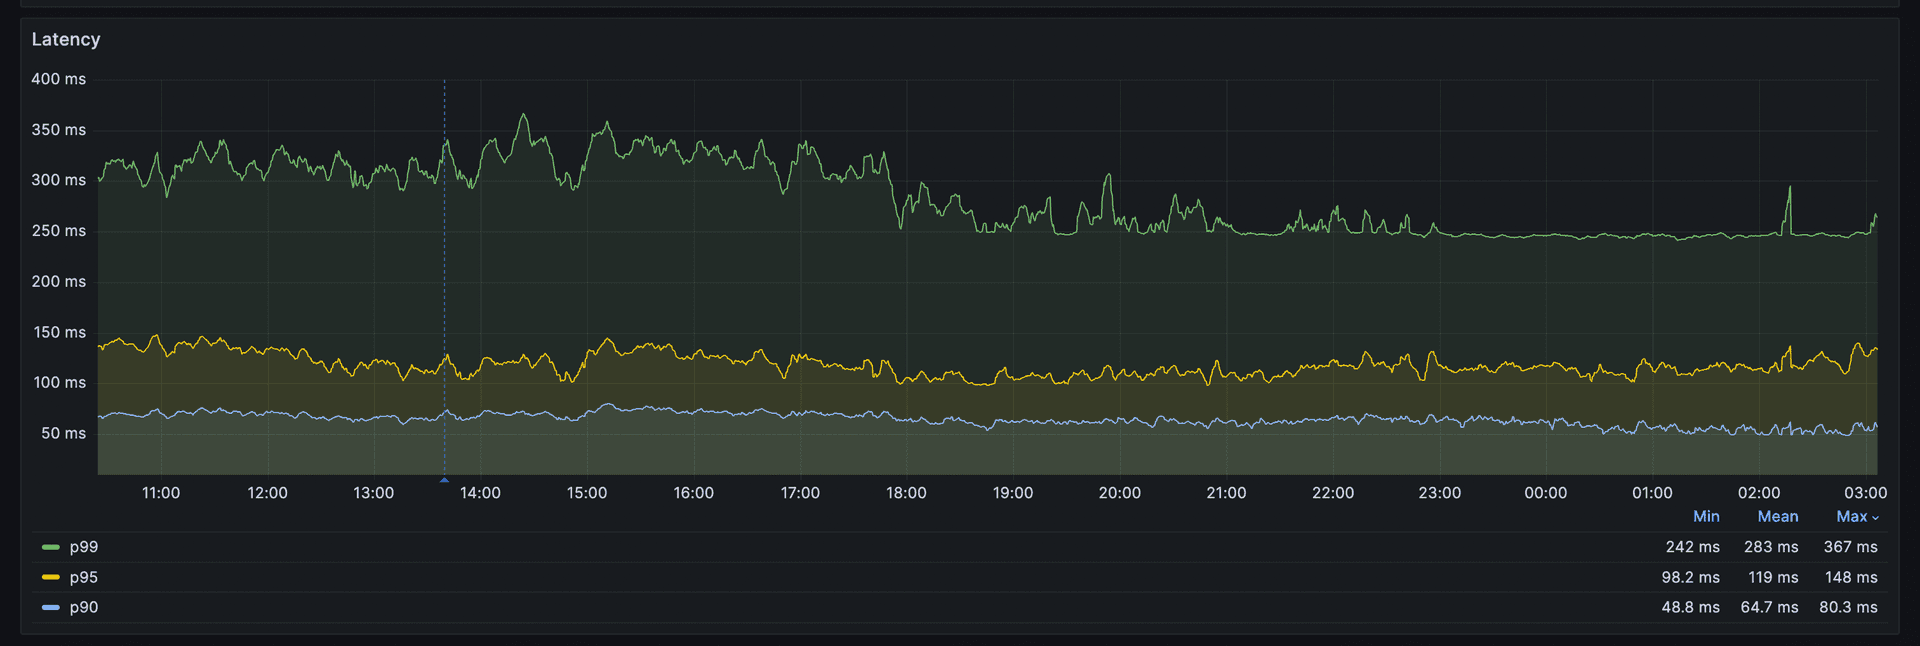
The Rust rewrite changed the economics dramatically. PostHog benchmarked axum at about 32,000 requests per second versus roughly 1,500 for Django, a 21x throughput difference. But speed in a benchmark is not the same as stability under load. Once the rewritten service was serving twice the traffic, the tail latency started misbehaving again, and the spikes were severe enough to reach seconds.
Why the usual suspects were innocent
At first glance, this looked like a database problem. It was not. Aurora RDS query execution times stayed stable, CPU utilization looked healthy, and the Horizontal Pod Autoscaler did not explain the pattern because it was scaling too late to match the latency spikes. That combination pushed the team away from the database and toward what was happening inside each pod.
The critical clue was CFS throttling. PostHog saw throttling rise in lockstep with p99 latency, which is the kind of symptom pair that should make any Rust team stop looking outward and start looking at runtime contention. In a Kubernetes environment, healthy-looking averages can hide the fact that Linux is rationing CPU time at the container level while your request path is trying to do too much in too many threads.
What Tokio and Rayon were doing to each other
The collision came from mixing Tokio and Rayon without giving each runtime a clean CPU budget. Tokio is built to keep async I/O moving, while Rayon is designed to chew through parallel CPU-bound work. If both are allowed to contend for the same cores under CPU quotas, the result is not graceful cooperation. It is oversubscription, then throttling, then a p99 graph that climbs into the seconds.
That is exactly the failure mode PostHog described in production. The service was not slow because Rust was slow. It was slow because the runtime mix created more runnable work than the pod could actually sustain, so CFS stepped in and stretched out tail latency. For a latency-sensitive feature flag path, that is enough to turn a fast rewrite into an operational incident.
How PostHog cut the spikes back down
The fix was not a magical new library or a database change. PostHog split CPU budgets between the runtimes instead of letting them fight over the same cores. In the follow-up tuning discussion, the team described environment-specific pod shapes, including prod-us at 8 vCPUs with 4 Tokio threads and 8 Rayon threads, plus about 3 semaphore permits, and prod-eu at 6 vCPUs with 3 Tokio threads and 6 Rayon threads, plus about 2 semaphore permits.
The important lesson is not the exact numbers. It is that the split matched the workload and the pod shape. A strict 50/50 split had starved Rayon, and that showed up as p99 batch times around 1,900 ms versus about 240 ms fleet-wide. The production configuration accepted roughly 50% CFS oversubscription and had already shown 7% to 30% throttling on the fleet, so the team treated throttling as a first-class metric instead of an after-the-fact explanation.
The result was blunt and measurable. PostHog says the change reduced mean p99 latency by 4x, from 2.5-second spikes to a flat 94 ms line. In a system where feature flag evaluation sits on the request path, that is the difference between an app feeling instant and an app feeling broken.
The checklist for mixing async and parallelism
Watch the symptom cluster, not just one metric
When Tokio and Rayon coexist in one service, the warning signs usually arrive as a pattern:
- p99 latency rises while average latency still looks fine
- database query times stay stable
- pod CPU looks busy but not obviously maxed out
- HPA reacts, but too late to explain the tail spikes
- container_cpu_cfs_throttled_periods_total climbs alongside latency
If those signals move together, suspect within-pod contention before you blame storage, caches, or the database.
Budget CPU for the runtime, not just the service
Async work and parallel CPU work are different species. Tokio wants enough threads to keep I/O flowing, while Rayon wants enough CPU to make batch work finish before the queue grows teeth. If both are sized from the same naive pod total, they can starve each other under CFS quotas.
A practical starting point is to assign the runtimes separate budgets and tune by environment. PostHog’s own numbers show that 8-vCPU and 6-vCPU pods did not want the same shape. The right answer depends on how much of your hot path is async I/O, how much is CPU-bound fan-out, and how hard your latency SLO punishes the tail.
Treat throttling as a release blocker, not a curiosity
PostHog’s recommendation was to monitor container_cpu_cfs_throttled_periods_total and reduce oversubscription if throttling stays above 30%. That threshold matters because throttling is not just an efficiency issue. In a hot path, it is a direct driver of user-visible stalls.
If throttling is in the 7% to 30% range and p99s are already wobbling, you are not in a healthy steady state. You are in the zone where a little more traffic, or a little more batch work, can flip the service from “fast enough” to “seconds at the tail.”
Re-test after every traffic shift
The PostHog incident only surfaced again once the Rust rewrite was under twice the traffic it had been handling before. That matters because a runtime mix that looks fine at one load level can collapse at the next. Every time traffic mix, pod size, or batch size changes, re-run the latency and throttling checks together.
Why this matters beyond one service
PostHog’s October 2025 post-mortem gives the broader warning label. Between October 21 and October 30, the feature flags service suffered four incidents that caused more than 14 hours of cumulative major impact, and three of those incidents shared the same root cause: improper CPU resource sizing. The Tokio and Rayon clash was not an isolated tuning annoyance. It was part of a recurring reliability pattern in a service that customers depend on to stay out of the way.
That is why this story lands so hard for Rust teams. The language can give you the tools to build something far faster than the old system, as PostHog proved with axum and the move off Django. But once you combine async and parallelism in production, the real constraint is not just code quality. It is whether your CPU budget, your container quotas, and your runtime model all agree on who gets to run next.
This article was produced by Prism’s automated news system from verified source data, official records, and press releases, then run through automated quality and moderation checks before publishing. The system is built and supervised by the people who set the standards it runs under. Read our full AI policy.
Did this article answer your question?