Baltimore Sun publishes updated neighborhood crime maps and tables
Baltimore’s updated crime maps put shootings, robberies and burglaries on the block-by-block level, but NIBRS changes mean residents should read year-over-year trends carefully.
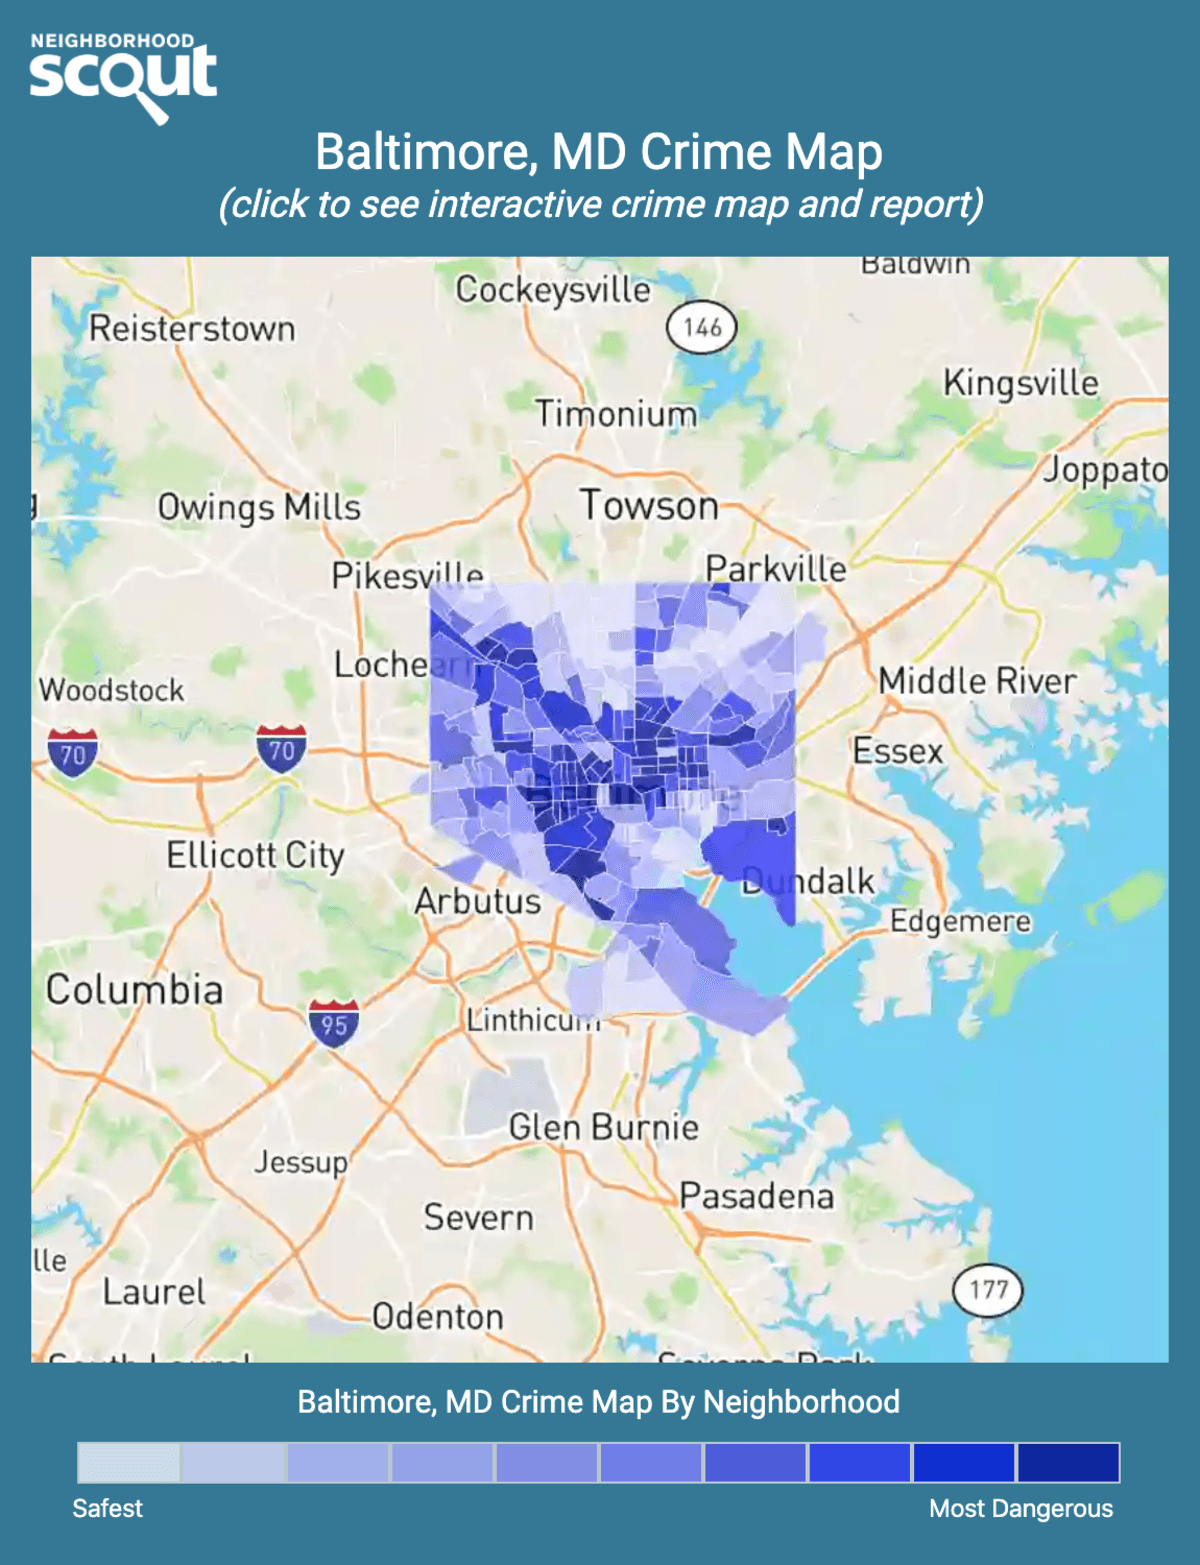
What the new maps show
Baltimore’s updated neighborhood crime maps and tables give residents a closer look at where shootings, robberies, car thefts, burglaries and other crimes are being reported, all the way down to individual blocks. That makes the package more than a data dump: it is a practical tool for checking whether a concern is isolated to one corner, part of a neighborhood pattern, or part of a wider city trend.

The biggest value is granularity. Instead of treating an entire neighborhood as one crime story, the tables and maps let Baltimoreans see how incidents cluster on specific blocks, which matters for people deciding where to walk, where to shop, where to invest in a storefront, and where to organize around public safety.
How the city’s crime data works
The underlying information comes from the Baltimore Police Department and Open Baltimore, but the two systems serve slightly different purposes. Baltimore Police says its Public Crime Map is based on general offense reports pulled from the department’s records system, covers the past 365 days, and is updated every morning. Open Baltimore’s NIBRS Group A dataset is updated weekly and includes major offenses dating back to January 1, 2022.
That distinction matters because crime data is not a fixed archive. The police department warns that the public map is preliminary and can change as reports are transcribed or investigations are updated. A single reported incident can also include multiple offenses under the NIBRS system, which means a block may appear to have more activity than older reporting methods would have shown.
Why comparisons got harder after Jan. 1, 2025
Baltimore Police says its switch to the National Incident-Based Reporting System took effect on January 1, 2025, and that is the point where careful readers need to slow down. NIBRS records crimes differently than the older Summary Reporting System, so a straight comparison between newer figures and older ones can be misleading if the reporting method changed the underlying counts.
The department also said in December 2025 that historical homicides from 2022 through 2025 would be removed from annual homicide counts to align with FBI and Maryland State Police guidance on NIBRS reporting. That change could affect year-to-year comparisons even when the public discussion sounds simple, because the same citywide total may be assembled differently depending on the reporting standard used.
For anyone reading the maps, the safest rule is to compare like with like. A recent block-level pattern can still be useful, but a year-over-year chart that straddles the NIBRS transition needs extra caution.
What the latest citywide numbers say
Even with those caveats, the broad trend lines in Baltimore’s public safety reporting have pointed downward. The police department reported that 2024 homicides fell to 201 from 261 in 2023, a 23% drop, while non-fatal shootings fell to 414 from 635, a 34% drop.
Midway through 2025, the department said the city was still seeing double-digit reductions, including 68 homicides compared with 88 in the same period of 2024, and 164 non-fatal shootings compared with 204. WMAR 2 News later reported that Baltimore finished 2025 with 133 homicides, down 61 from 2024, and that April 2026 logged 4 homicides and 29 non-fatal shootings.
Those numbers do not tell the whole story on any one street, but they do show why the maps matter. Citywide improvement can coexist with stubborn hot spots, and a quieter quarter can still leave certain blocks under pressure from recurring gun violence or property crime.
How to read your block without overreacting
A single block can jump on the map for reasons that have little to do with a long-term trend. One incident may involve multiple offenses, one month can look worse than the last, and a cluster can fade as quickly as it appeared once a report is corrected or investigated. The police department’s own warning that records are preliminary is a reminder not to treat any one spike as the final word.
When you check your block or neighborhood, look for a few basics:
- Whether the same offense keeps appearing in the same place, or whether the problem is shifting to nearby streets
- Whether the activity is concentrated in one block or spread across several blocks in the same area
- Whether the issue is violent crime, like shootings or aggravated assault, or property crime, like burglary, larceny or auto theft
- Whether the pattern lasts over weeks and months, not just a few days
That approach is especially important in Baltimore because the GIS unit says hundred-block maps are meant to show where crimes cluster at a more granular level, including concentrations of gun violence. The point is not to sensationalize one block. It is to help residents and institutions see whether the pattern is persistent enough to justify a response.
What residents, businesses and groups should watch
The most useful next step is local observation, not panic. Residents should pay attention to whether incidents keep showing up on the same stretch of a street, whether lighting and foot traffic seem to match the crime pattern, and whether a place is seeing repeated calls tied to the same kind of offense. Businesses can use the maps to decide where to strengthen cameras, coordinate with nearby merchants, or adjust closing routines.
Community groups should watch whether repeated incidents line up with the same corner, the same corridor, or the same few addresses, because those are the places where block-level interventions can be most focused. The city’s transparency push, which includes the public safety dashboard launched in 2023, is meant to support exactly that kind of neighborhood-level accountability under Mayor Brandon M. Scott and Police Commissioner Richard Worley.
The updated Baltimore Sun tables and maps are useful because they strip away the abstraction. They show where crime is reported, how it moves from block to block, and why Baltimoreans need to read the numbers with both urgency and discipline.
Know something we missed? Have a correction or additional information?
Submit a Tip