Harris County Hub Offers Residents Maps, Data on Local Services
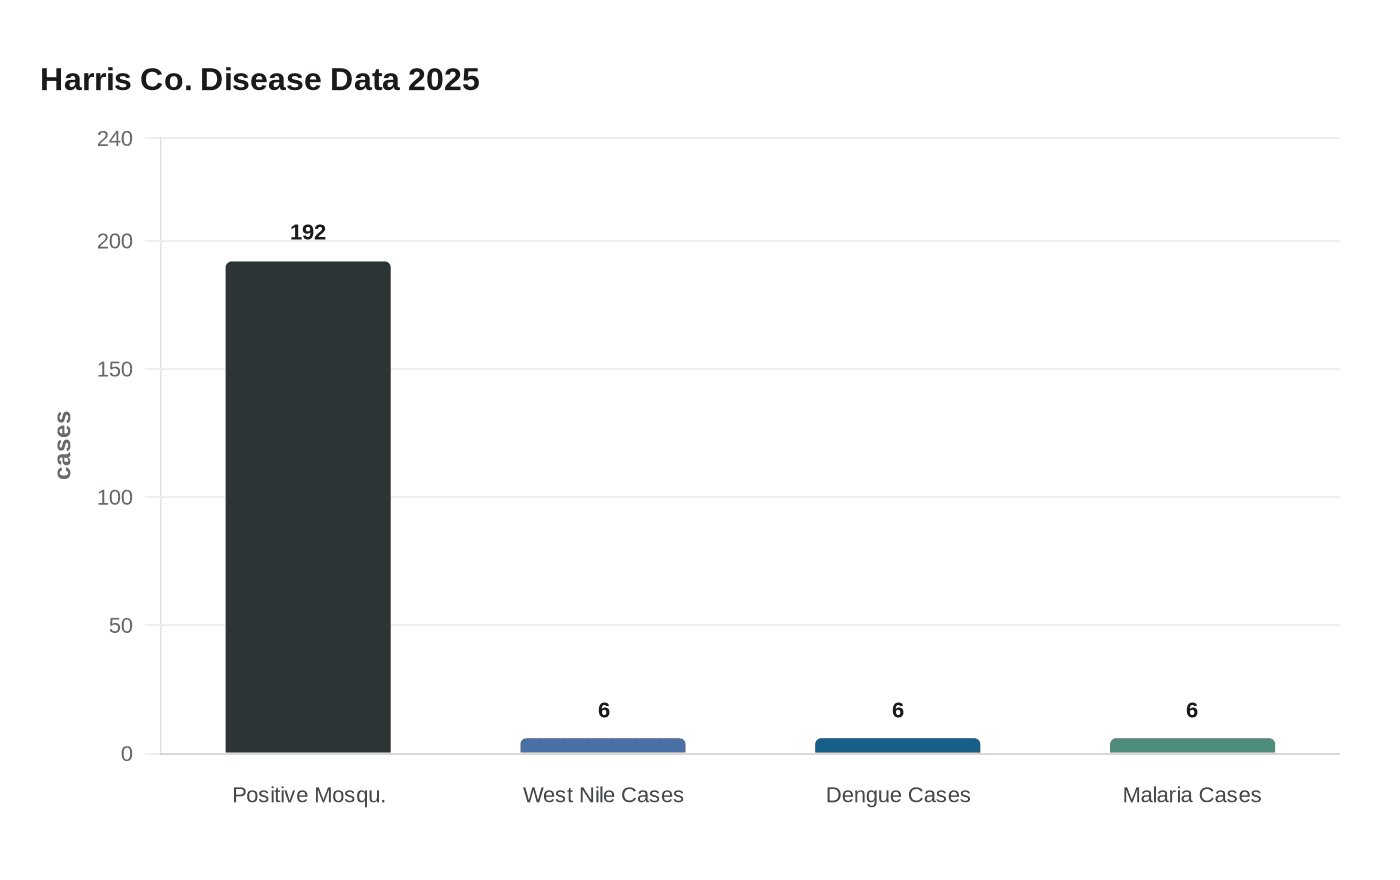
Harris County's free data hub puts mosquito tracking, flood maps, and air quality readings at the ZIP-code level — 192 positive mosquito samples were logged countywide in 2025 alone.

Type a ZIP code into Harris County's Dashboards & Datasets Hub and the county's flood drainage maps, air quality monitor readings, mosquito surveillance data, and public health trends resolve to the neighborhood level within seconds. The hub, maintained by Harris County's administrative and departmental teams, is the county's central clearinghouse for interactive visualizations and machine-readable datasets spanning public health, environmental monitoring, emergency management, and infrastructure, and it gives any resident the same analytical tools available to government planners and environmental advocates.
Five of the most practical questions it can answer, and how to reach each one: To check mosquito activity, navigate to the Public Health category on the hub's landing page and open the mosquito-borne illness dashboard that Harris County Public Health launched in October 2025. The department recorded at least 192 positive mosquito samples countywide through mid-October of that year, alongside six confirmed West Nile virus cases, six travel-related dengue cases, and six travel-related malaria cases. That figure, 192 positive samples in a single season, is the kind of localized count that shifts mosquito season from an abstraction into a quantified neighborhood risk.
For flood incidents and drainage status, open the Flood Control and Drainage Maps section under the infrastructure category and enter a street address or ZIP code. The Harris County Flood Control District's interactive layers display drainage project timelines, historical inundation extents, and FEMA flood-zone boundaries on a single canvas. To check air quality near the Ship Channel industrial corridor, select the Pollution Control Services data layer, which logs ambient monitor readings and tracks community odor and emissions complaints alongside county response records. Residents in East Houston ZIP codes 77020 and 77029 sit within two miles of the country's largest petrochemical complex, making that layer one of the most consequential on the hub for those neighborhoods. For public health metrics including emergency indicators, TB surveillance, vaccination clinic locations, and disease trend lines, the public health indicators section allows filtering by date range or census tract. Traffic and permitting dashboards, reachable under the infrastructure category, show scheduled road projects and permitting status that affect commutes, school zones, and outdoor events.
To export any dataset, click the download or API link on each individual dashboard panel. Most support CSV and JSON formats compatible with Excel, Google Sheets, or GIS mapping software. Homeowner associations and community groups can preserve geographic and date filters by bookmarking the direct dashboard URL, then sharing that link at meetings so every member opens the same neighborhood view. The hub's landing page lists a named departmental data steward for each major category, the fastest path to requesting unpublished datasets or clarifying metadata such as update frequency and geographic resolution.
One practical limit worth noting: update cadences differ sharply across the hub. Air quality monitors and emergency status boards refresh in near real time, while some health surveillance and permitting datasets post monthly or quarterly. For environmental, legal, or public health questions with formal stakes, pair hub findings with primary records from the Texas Commission on Environmental Quality, Texas DSHS, or FEMA before drawing conclusions. For neighborhood advocacy work, those downloadable CSVs paired with census or FEMA data can document service gaps or industrial proximity in a form that public agencies are required to address.
This article was produced by Prism’s automated news system from verified source data, official records, and press releases, then run through automated quality and moderation checks before publishing. The system is built and supervised by the people who set the standards it runs under. Read our full AI policy.
Did this article answer your question?