How Harris County flood control tracks its drainage network
Harris County’s flood maps are built around watershed and unit codes like U100-00-00. Read the label near your street, and you can trace risk, projects, and drainage responsibility.
Langham Creek’s U100-00-00 is not a random label on a Harris County flood map. It is the fastest way to understand which bayou, creek, or drainage corridor controls water near your home, which projects are planned there, and which public systems will matter when rain starts falling hard.
Start with the watershed, not the street
The Harris County Flood Control District was created by the Texas Legislature in 1937 after the floods of 1929 and 1935, and its jurisdiction matches Harris County itself, including the City of Houston. The county is enormous by local standards, with a U.S. Census Bureau July 1, 2025 population estimate of 5,045,026 and 1,707.3 square miles of land area. It is the third-largest county in the U.S. by population, which helps explain why one drainage map has to serve everything from dense urban blocks to large unincorporated areas.
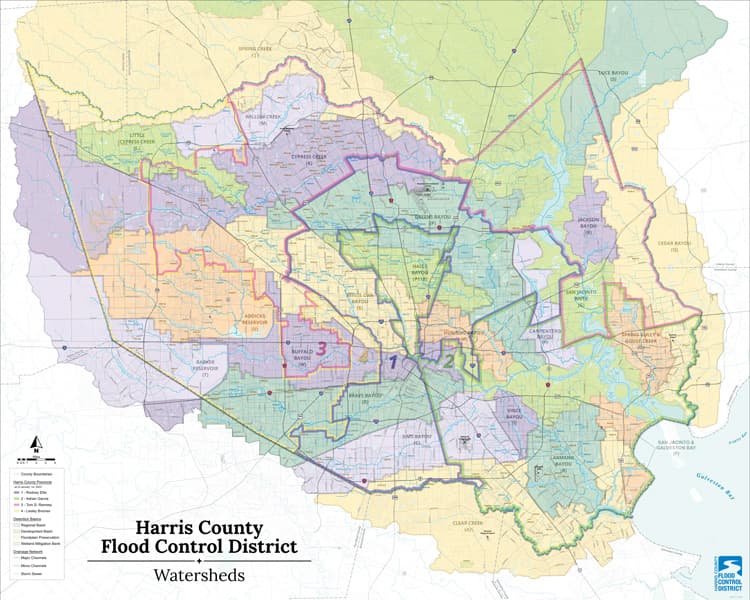
The district organizes that territory into 23 primary watersheds within Harris County’s 1,777 square miles. Those watersheds are the first clue residents should look for, because they tell you which larger drainage system your block belongs to before you ever get to a street name or a subdivision. Buffalo Bayou is one of the county’s most familiar names, but the same logic applies across the county: every neighborhood drains somewhere, and that “somewhere” is the unit the district uses to plan work.
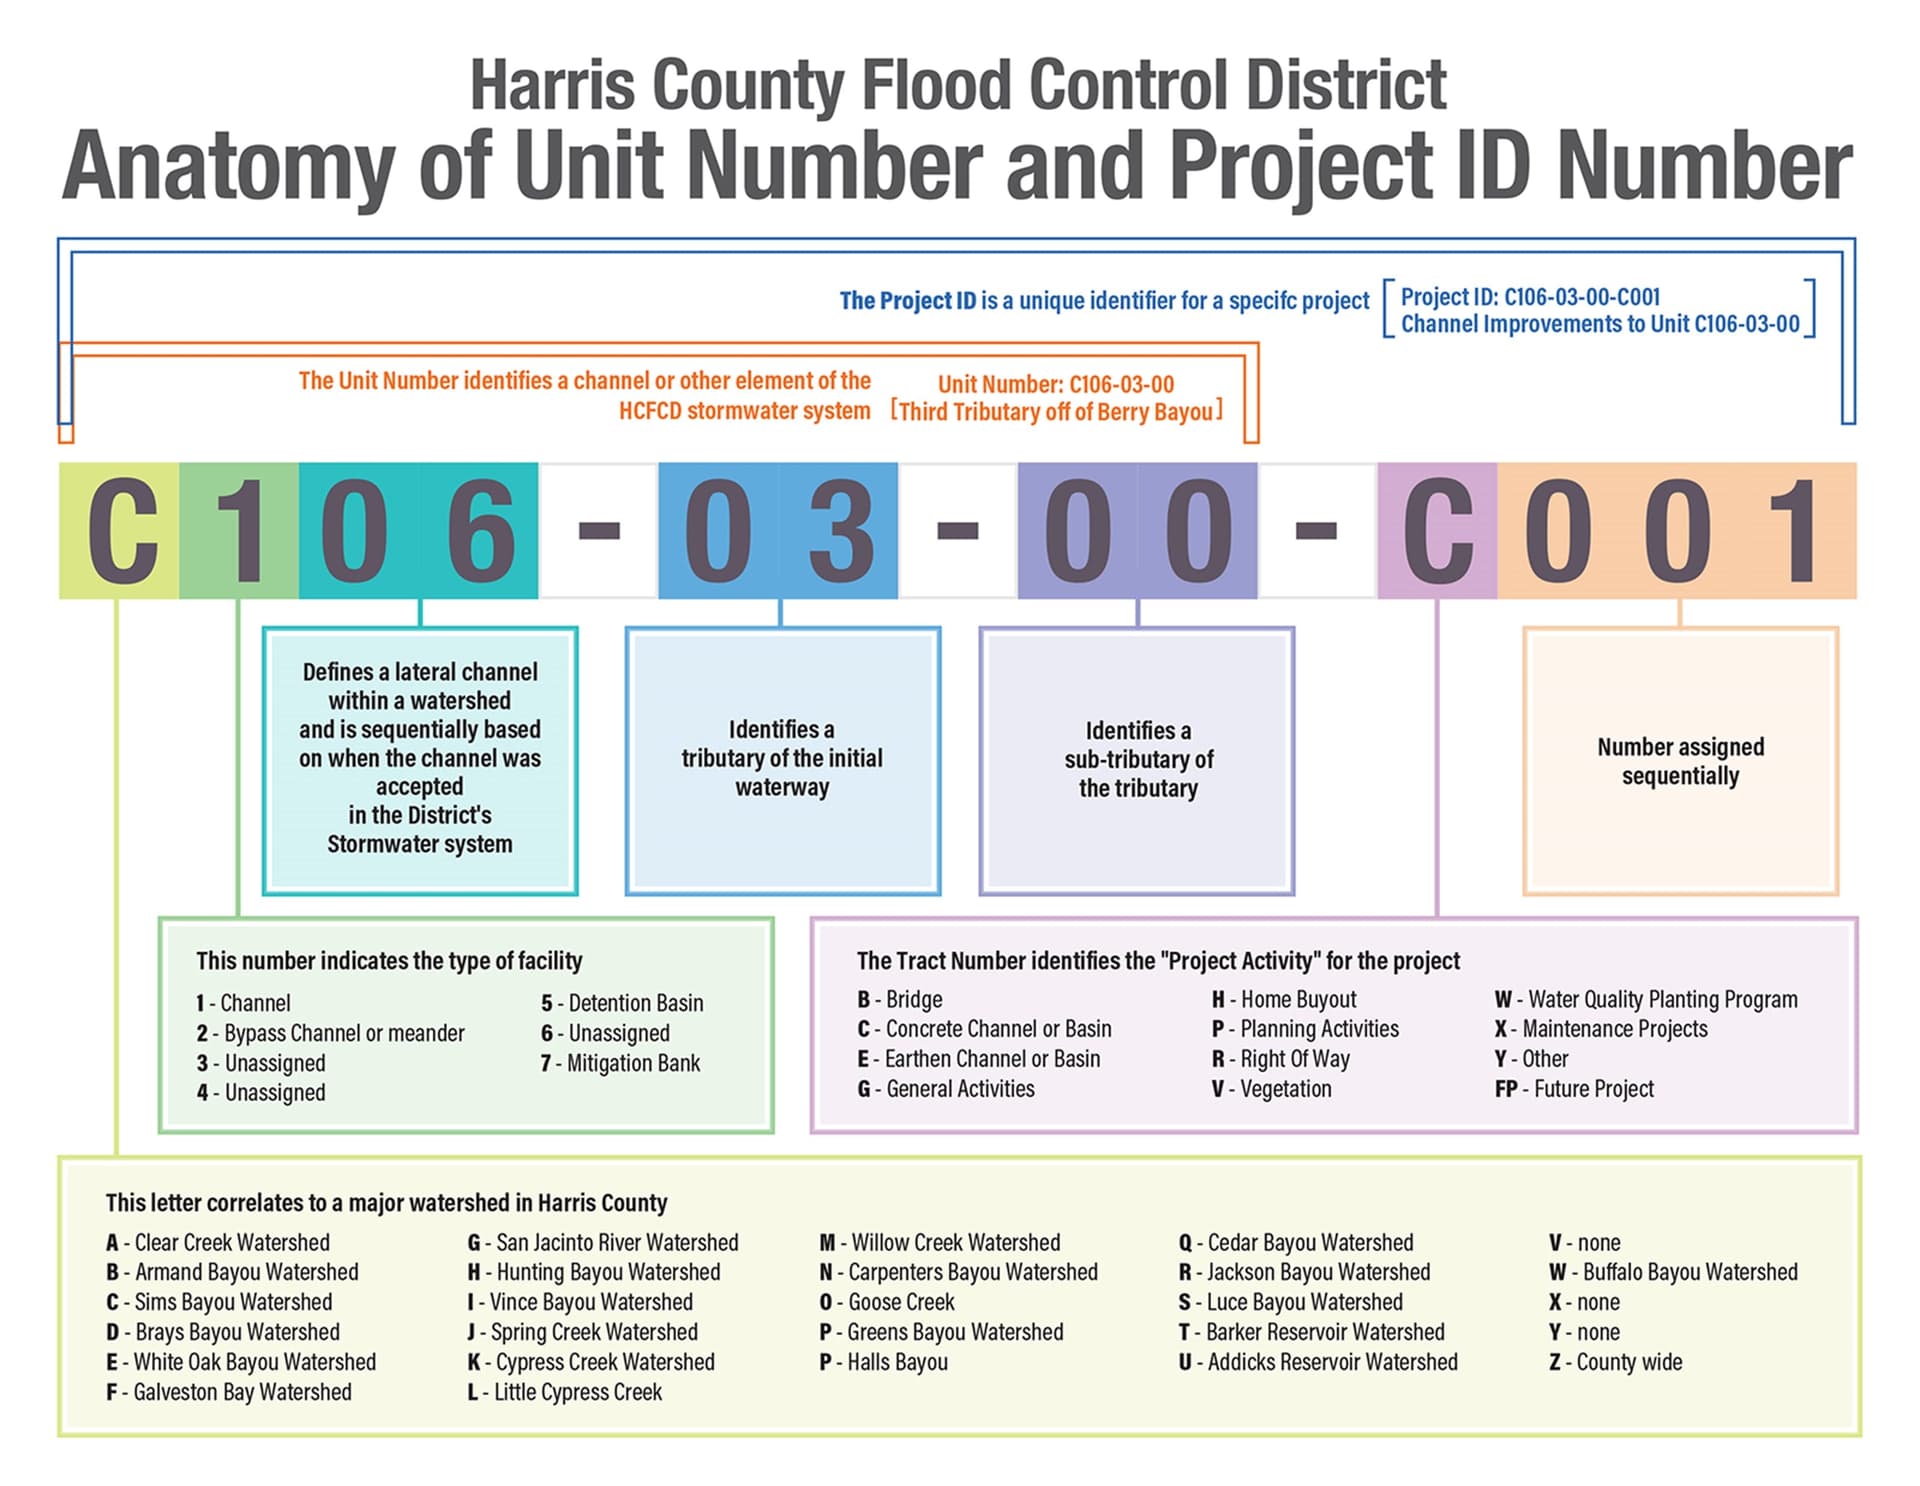
What the unit-numbering system tracks
HCFCD uses a unit-numbering system to keep track of its drainage infrastructure, including about 2,500 miles of bayous and channels, more than 300 stormwater detention basins, and hundreds of construction and maintenance projects. If you see one of those codes, you are looking at the district’s identifier for a specific drainage corridor.
The code ties the physical channel to the district’s records. Engineers use it to organize design work, maintenance, and capital construction; planners use it to line up projects with the watershed they benefit; and residents can use it to connect a map label to a place they actually know, such as a creek behind a subdivision, a bayou crossing a major road, or a reservoir watershed upstream of their block. Addicks Reservoir is a good example: its watershed covers 138 square miles in western Harris County and a small part of eastern Waller County, and it drains to Langham Creek, U100-00-00.
Why the code on the map tells you something about flood risk
If your home sits inside the Addicks watershed, or along a channel tied to a numbered unit, you are looking at the drainage system that will carry runoff away from streets, yards, and ditches when storms overload the ground. The district uses the unit-numbering system to track drainage infrastructure, construction projects, and maintenance projects, so the code on a map is also a signpost for where public crews have to work and where future flood-reduction projects may land.
Detention basins are part of that same system. HCFCD maintains more than 300 of them, and those basins are where stormwater can be held before it moves downstream into channels and bayous. For a resident, that means a basin near a neighborhood is not just open space on a map; it is part of the storage capacity that helps slow water during a storm.
How to use the district’s tools when rain is moving in
Flood risk reaches every neighborhood, even if the nearest bayou is not visible from the front door. By HCFCD’s count, a major flood occurs somewhere in Harris County about every two years. The district’s interactive mapping tools and Harris County Flood Warning System are useful during storm season.
The safest way to read the map is to start with the watershed name, then look for the nearest labeled channel or basin on the district’s maps. If the map points you to a named system such as Langham Creek or Buffalo Bayou, that tells you which drainage corridor is receiving water from your area. During heavy rain, the Flood Warning System gives residents another layer of context, because channel conditions and inundation maps can show whether water is rising in the watershed tied to your block.
Why this system exists at all
Harris County’s flood-control network grew out of repeated disasters. The Texas State Historical Association records the 1935 Houston flood as the worst in the city’s history up to that time and counts 16 major floods in Harris County from 1836 to 1936. Many flooding problems are in areas built before modern flood-potential understanding and before regulations restricted construction in flood-prone places.
The county still leans heavily on mapping, numbering, and public floodplain rules. The Harris County Engineer’s office and county floodplain management work alongside HCFCD, and Harris County participates in FEMA’s Community Rating System, which ties floodplain management to flood insurance and public education. HCFCD has also been a member of FEMA’s Cooperating Technical Partners program since 2000, which helps keep floodplain mapping and technical data current as development and rainfall patterns change.
What the bond money changed on the ground
After Hurricane Harvey, Harris County voters approved $2.5 billion in bonds on August 25, 2018 for flood-damage reduction projects, a major source of recovery and resiliency funding. The bond became the county’s largest local commitment to flood resilience, and those unit numbers residents see on project pages help determine where that money gets spent.
This article was produced by Prism’s automated news system from verified source data, official records, and press releases, then run through automated quality and moderation checks before publishing. The system is built and supervised by the people who set the standards it runs under. Read our full AI policy.
Did this article answer your question?