Caught up in the NBA playoffs?
Carolina’s pressure and Vegas’s power play collided in a Final where special teams and goaltending looked like the sharpest separators.

The Stanley Cup Final opened as a clash of two heavyweights who won in different ways. Carolina arrived at Game 1 at Lenovo Center in Raleigh with a 12-1 playoff record and only one loss in three rounds, while Vegas came in on a six-game run after sweeping Colorado, the Presidents’ Trophy winner, to reach its third Final in nine seasons. The best-of-seven series was scheduled for an 8 p.m. ET start on Tuesday, and the numbers suggested how tight it could be: both clubs had allowed the fewest and third-fewest goals against in the field, while each was scoring more than three goals a game.
Carolina’s identity was pressure. The Hurricanes led the postseason in 5-on-5 shot attempts percentage at 58.8, offensive-zone time at 47.2 and takeaways per 60 minutes at 5.54, a profile that matched Rod Brind’Amour’s insistence on structure, puck pressure and disciplined layers in front of Frederik Andersen. The depth was real too: Logan Stankoven led all playoff skaters in 5-on-5 shot attempts differential at plus-111, Taylor Hall led the postseason in even-strength points with 14, and defensemen Alexander Nikishin and Shayne Gostisbehere were among the league leaders in offensive-zone time.

Vegas arrived with a different blueprint. The Golden Knights led the playoffs with 34 high-danger goals, and their power play had produced 11 goals in 46 chances, a 24 percent rate that gave Jack Eichel, Mitch Marner and Mark Stone another way to break a game open. Brett Howden and Pavel Dorofeyev were tied for the playoff lead with 10 goals, and both also led the field in high-danger finishing, which made Vegas less dependent on grinding out every zone shift. The Knights were not trying to outspend Carolina in shots; they were trying to make the few dangerous looks count.
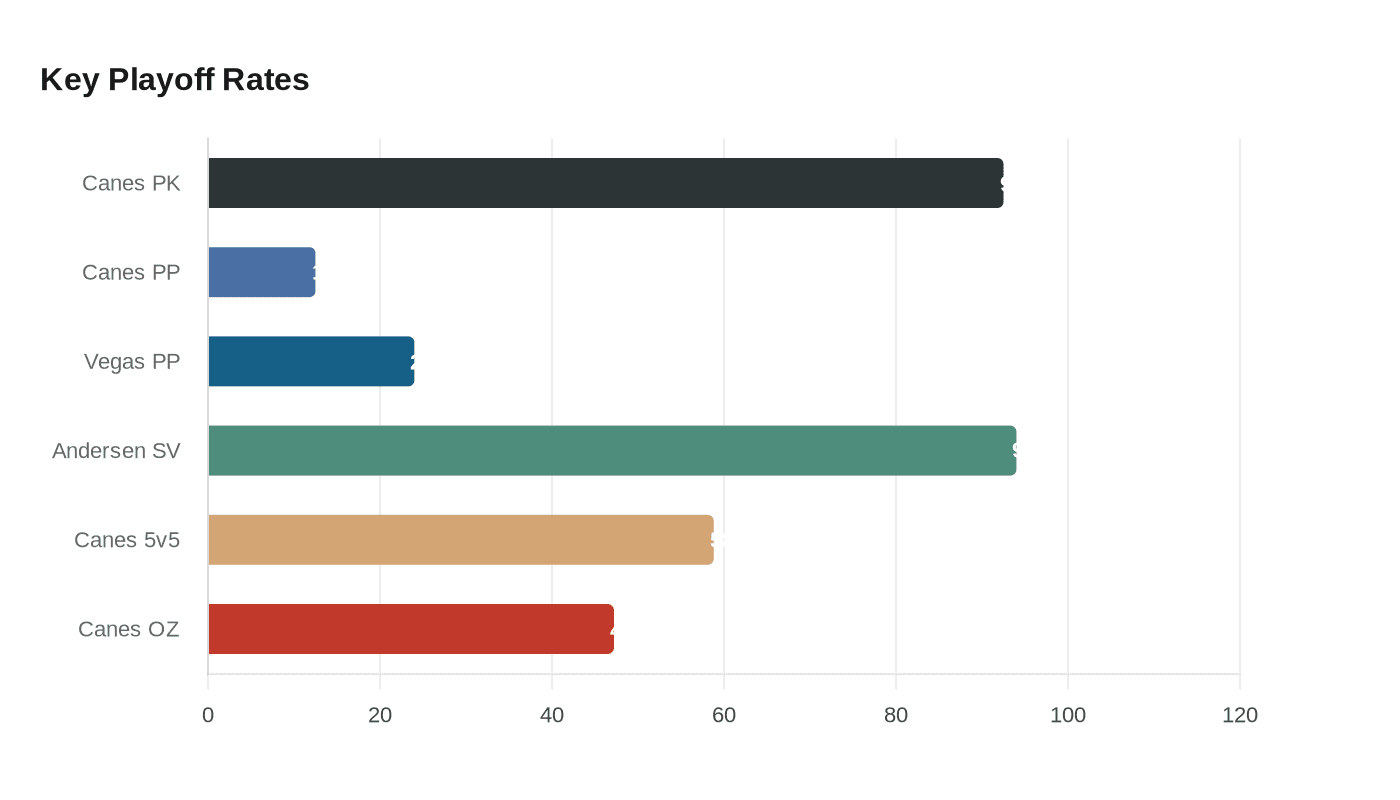
That left two matchups that looked most likely to decide the series: Carolina’s forecheck against Vegas’s puck management, and special teams against special teams. The Hurricanes’ penalty kill was running at 92.5 percent, allowing four power-play goals and scoring once shorthanded, but Carolina’s own power play was only 7 for 56 in the postseason, a 12.5 percent clip. Frederik Andersen gave Carolina its clearest edge in goal, entering the final at 12-1 with a .940 5-on-5 save percentage and a 5-0 record in overtime games, so if the game stayed at five-on-five the Hurricanes’ volume and pressure could matter most. If penalties and rebound chances opened the ice, Vegas had the more dangerous conversion rate.
This article was produced by Prism’s automated news system from verified source data, official records, and press releases, then run through automated quality and moderation checks before publishing. The system is built and supervised by the people who set the standards it runs under. Read our full AI policy.
Know something we missed? Have a correction or additional information?
Submit a Tip