Gold Market Pricing Trends Shape Key Financial Decisions for Investors
Gold hit an all-time high of $5,595 in January 2026, and with J.P. Morgan forecasting $5,055/oz by year-end, the metal's pricing dynamics carry real weight for investor portfolios.

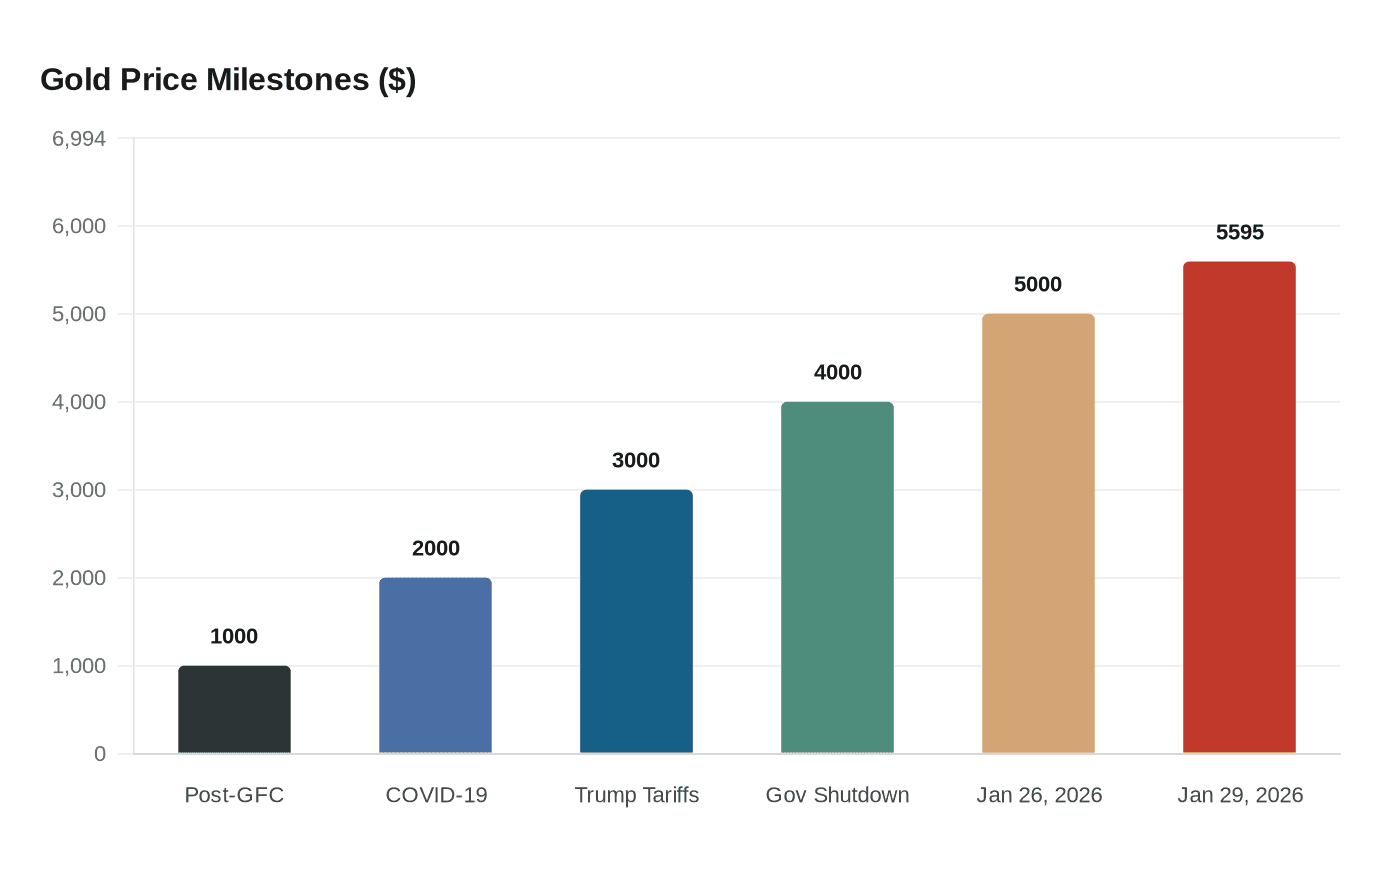
Few financial assets have commanded investor attention quite like gold in recent months. Gold had a phenomenal, if very volatile, start to 2026: the move above $5,000 on January 26 appeared to unleash a wave of speculative buying, pushing gold to an intraday high of $5,595 by January 29. That single month captured the entire spectrum of what makes gold simultaneously compelling and challenging to position around, and it set the tone for the financial decisions that institutional and retail investors alike must now navigate.
A Historic Bull Run Built Over Years
To understand where gold stands today, it helps to trace the price milestones that brought it here. Gold has long reflected global economic and political stress, with its price typically rising during periods of heightened uncertainty. In the wake of the global financial crisis, gold surged past $1,000. During the Covid-19 pandemic, it climbed to $2,000. Then, when Trump announced tariffs, it surpassed the $3,000 mark, and the $4,000 mark was hit during the recent prolonged U.S. government shutdown.
Gold demand hit record levels in 2025. Total gold demand, including OTC trading, topped 5,000 tonnes during a year that saw 53 all-time highs in the gold price. That kind of sustained upward pressure does not emerge from a single variable. It reflects a convergence of macroeconomic forces that investors need to evaluate individually.
What Is Actually Driving Prices
The demand story behind gold's rise is multi-layered. Gold has served both as a debasement hedge, a form of protection against the loss of a currency's purchasing power due to inflation or currency debasement, and in its more traditional role as a non-yielding competitor to U.S. Treasuries and money market funds.
More recently, gold has benefited from deteriorating macroeconomic conditions, including geopolitical uncertainty globally, tariff and sanctions policy volatility, and growing questions about U.S. dollar reserve status, all of which are driving demand for alternatives to the dollar. Foreign central banks now hold more gold than U.S. Treasuries.
On the quantitative side, "In the third quarter of 2025, investor (ETFs, futures, bars and coins) and central bank gold demand totalled around 980 tonnes, over 50% higher than the average over the previous four quarters," said Gregory Shearer, head of Base and Precious Metals Strategy at J.P. Morgan. At average gold prices of $3,458/oz in Q3 2025, that 950-tonne figure translated to approximately $109 billion of quarterly demand inflow, about 90% higher than the prior four-quarter average.
Central Bank Buying Remains Structural
Central banks are one of the most consequential forces in the gold market, and their buying behavior shapes price floors that retail investors often underestimate. Around 755 tonnes of central bank purchases are expected in 2026, a step lower than the peak of the last three years of more than 1,000 tonnes, but still elevated when compared with pre-2022 averages, which were closer to 400–500 tonnes.
This decline is more of a mechanical change in central bank behavior rather than a structural shift. With prices around $4,000/oz and above, central banks simply don't need to purchase as many tonnes of gold to move their gold share to the desired percentage. This surge has been driven, in part, by robust central bank demand, including from emerging markets such as China, India, and Turkey.
ETF and Retail Demand Add Fresh Layers
Institutional vehicles and physical retail channels are reinforcing central bank activity with their own demand. U.S. gold demand more than doubled to 679 tonnes in 2025, driven almost entirely by strong investment demand in physically gold-backed ETFs. U.S.-listed ETFs added 437 tonnes of demand, pushing holdings to a record 2,019 tonnes, equivalent to $280 billion in assets under management.
Looking forward, J.P. Morgan Global Research forecasts ongoing robust investor demand for gold, with around 250 tonnes of inflows into ETFs expected in 2026, while bar and coin demand is once again set to surpass an elevated 1,200 tonnes of annual demand. Falling interest rates are a key catalyst for this ETF activity: falling front-end yields have historically coincided with strong inflows into gold-backed ETFs.
Volatility Is Part of the Equation
The record highs of January 2026 did not hold cleanly, and investors who entered positions near the peak absorbed sharp short-term losses. Gold ended January at $4,894, still up over 13% for the month, but the kind of price action seen in late January made a pullback almost inevitable. February proved turbulent, with Jeffrey Christian, managing partner at CPM Group, noting that upward of 200 million ounces of gold futures contracts were bought during the month, amplifying swings in both directions.
The broader implications for energy markets and inflation have begun to set in for economists, policymakers, and investors alike. The potential for rates to remain on hold or even increase is now placing downward pressure on gold, with the price sinking back to around $4,500 near the end of Q1. As of late March 2026, gold was trading near $4,568, well below its January peak but still historically elevated.
Price Forecasts and the Range of Scenarios
The institutional consensus for the remainder of 2026 leans bullish, but with meaningful scenario dispersion. J.P. Morgan Global Research is forecasting prices to average $5,055/oz by the final quarter of 2026, rising toward $5,400/oz by the end of 2027. Goldman Sachs raised its year-end 2026 gold target to $5,400 in late January, while consensus forecasts for the XAU/USD in 2026 remain upbeat, with prices expected to rise toward the $5,155–$5,515 range, though a decline to $3,775 cannot be ruled out.
The World Gold Council frames the outlook around three distinct macroeconomic scenarios. If economic growth slows and interest rates fall further, gold could see moderate gains. In a more severe downturn marked by rising global risks, gold could perform strongly. Conversely, a successful outcome from policies set by the Trump administration would accelerate economic growth and reduce geopolitical risk, leading to higher rates and a stronger U.S. dollar, pushing gold lower.
Portfolio Allocation: What the Data Suggests
For investors translating price dynamics into portfolio decisions, allocation sizing is the most actionable takeaway. Most practitioners suggest keeping total precious metals exposure somewhere between 5% and 15% of a diversified portfolio, a range broad enough to accommodate different views but narrow enough to be meaningful.
Gold has outperformed traditional asset classes over the last 25 years. As an investment, it helps enhance portfolio diversification, acts as a store of value, and offers a hedge against systemic risk. Notably, even with the price volatility spike across alternative-fiat markets in 2026, gold has been less volatile and more stable than its alternative-fiat counterparts, including bitcoin and silver. That relative stability matters for investors weighing gold against other inflation hedges.
The path from $1,000 post-financial crisis to today's $4,500-plus range has been punctuated by geopolitical shocks, policy pivots, and waves of institutional buying that successive generations of market observers once considered impossible. With central banks structurally reorienting their reserves away from dollar assets and ETF demand building a durable institutional base, the pricing dynamics now shaping gold markets are not a cyclical curiosity. They are a permanent feature of the investment landscape that serious financial decision-making cannot afford to ignore.
This article was produced by Prism’s automated news system from verified source data, official records, and press releases, then run through automated quality and moderation checks before publishing. The system is built and supervised by the people who set the standards it runs under. Read our full AI policy.
Did this article answer your question?