New economic justice dashboard gives Kaua‘i granular data for advocacy
A new online dashboard provides county and district data on poverty, housing, food and health access, helping Kaua‘i planners and advocates target equity efforts.
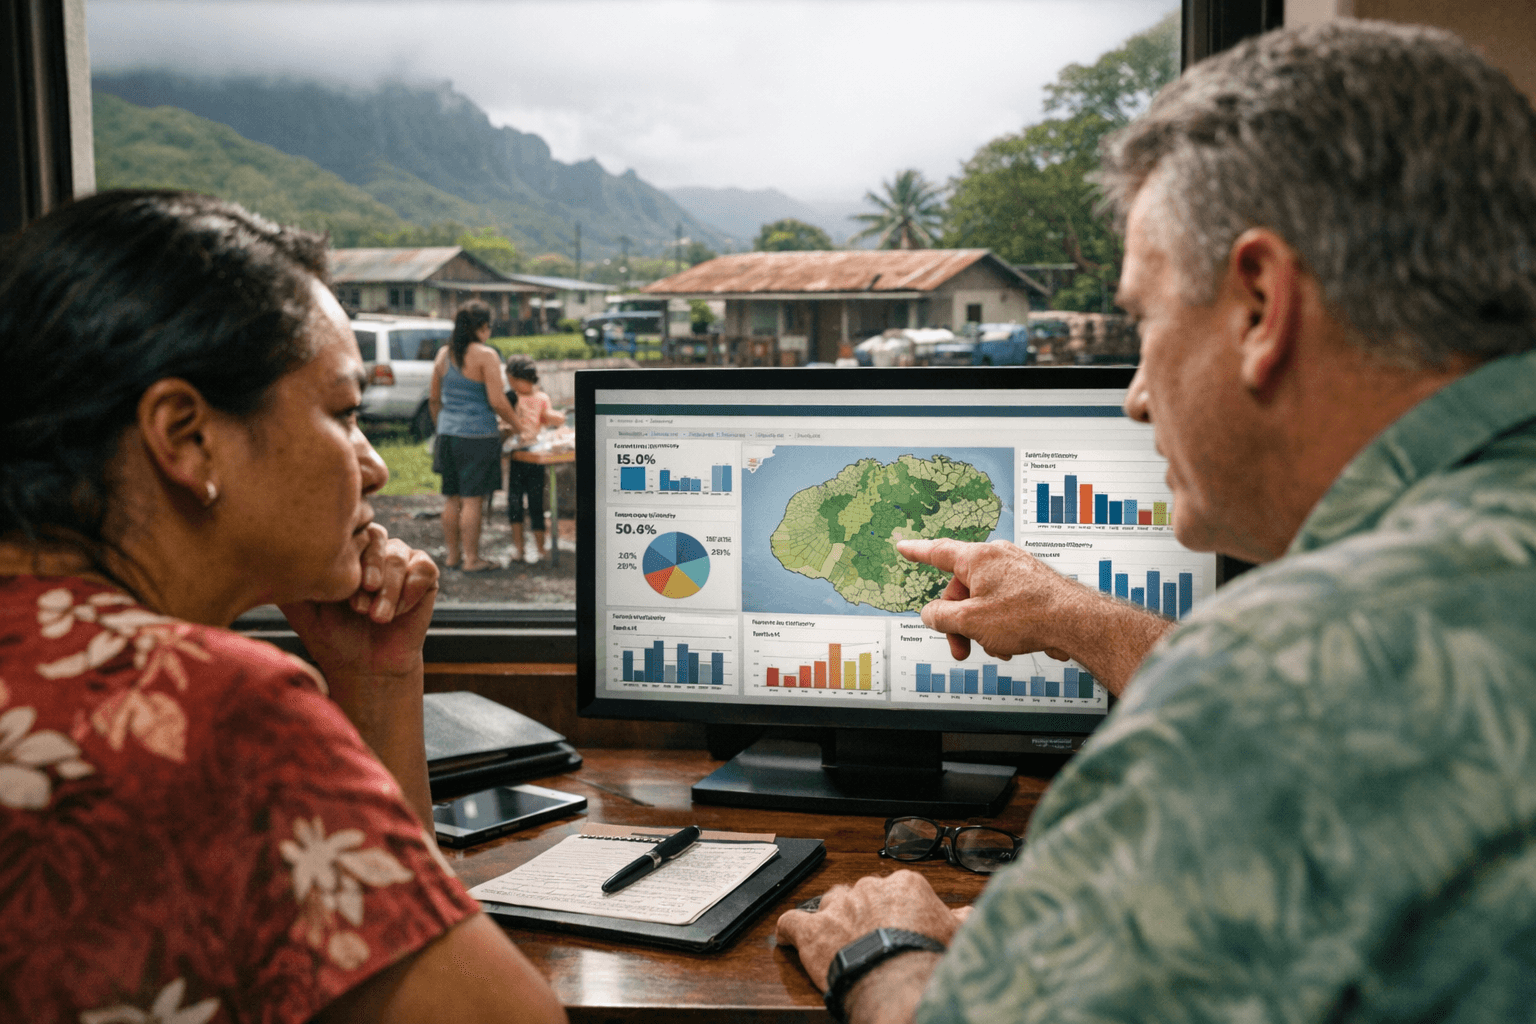
On Jan. 14, 2026 the Hawai‘i Appleseed Center for Law & Economic Justice launched an online Economic Justice Data Dashboard designed to give policymakers, advocates and community members localized data on well-being. The interactive tool presents county- and legislative-district-level visualizations for indicators including poverty, housing cost burden, food insecurity and access to health care, creating a single, user-friendly place to compare communities across the state.
For Kaua‘i residents, the dashboard aims to fill a long-standing gap in accessible, neighborhood-level information. Small island communities often see countywide averages that mask disparities between neighborhoods from Lihue to Kapa‘a and Hanalei. By breaking data down to legislative districts, the tool makes it easier for island lawmakers and grassroots organizations to identify where needs are highest and to target interventions that address those gaps.
The dashboard’s visualization features are intended for practical planning and advocacy. Local nonprofits can use up-to-date maps and charts to shape grant proposals and outreach strategies. Public health planners and community health centers can use health access indicators to prioritize mobile clinics, enrollment drives and partnerships with food distribution programs. County officials and legislative staff can use the district-level view to monitor progress on equity-focused initiatives and to make data-driven budget and policy decisions.
Beyond immediate programmatic uses, the dashboard is positioned as a transparency and accountability tool. Community-based organizations and residents can track changes over time on core measures that affect daily life: whether families are spending too much on housing, whether hunger persists in certain neighborhoods, and whether residents have affordable access to primary and behavioral health services. That kind of localized information can sharpen advocacy campaigns and help align county investments with on-the-ground need.
The public health implications are clear: better data supports more precise prevention and care strategies. Targeted responses to food insecurity, for example, reduce strain on emergency services and improve chronic disease outcomes. Identifying pockets of poor health access can inform policy discussions about workforce distribution, transportation barriers and clinic hours that work for Kaua‘i families.
This dashboard is a tool for translating numbers into action. For Kaua‘i residents and leaders, the next step is to put those visualizations into regular use, by incorporating them into community health needs assessments, legislative priorities and nonprofit program design. With accessible, localized data now available, stakeholders have a stronger basis for claiming resources, measuring progress and advocating for policies that advance economic and health equity across the island.
Sources:
Know something we missed? Have a correction or additional information?
Submit a Tip

-1.webp&w=1920&q=75)