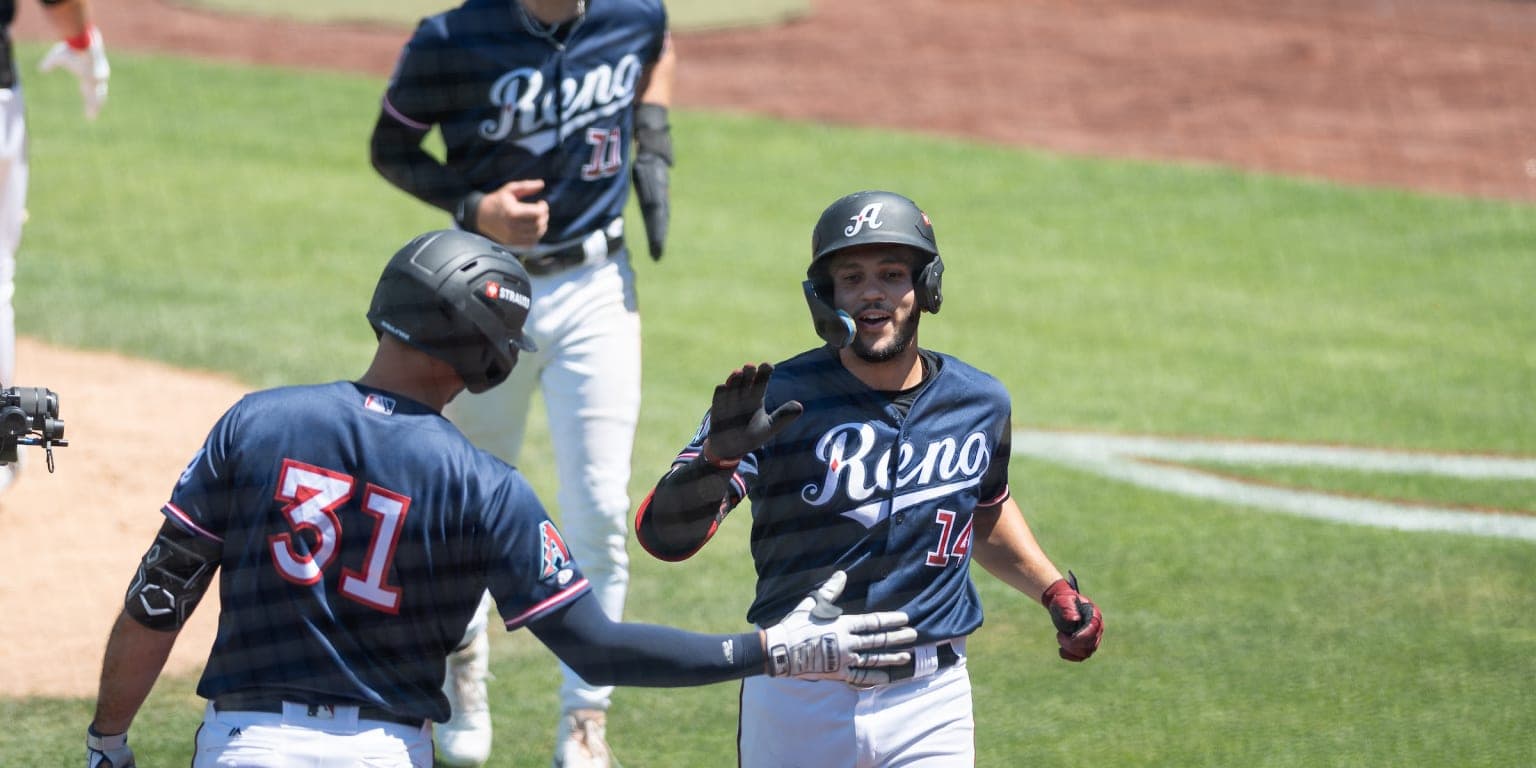
Why Triple-A stats need context across the International League and PCL
Triple-A stat lines can fool you: the PCL and International League play in different run environments, from Colorado Springs' altitude to Durham's deep left-field wall.
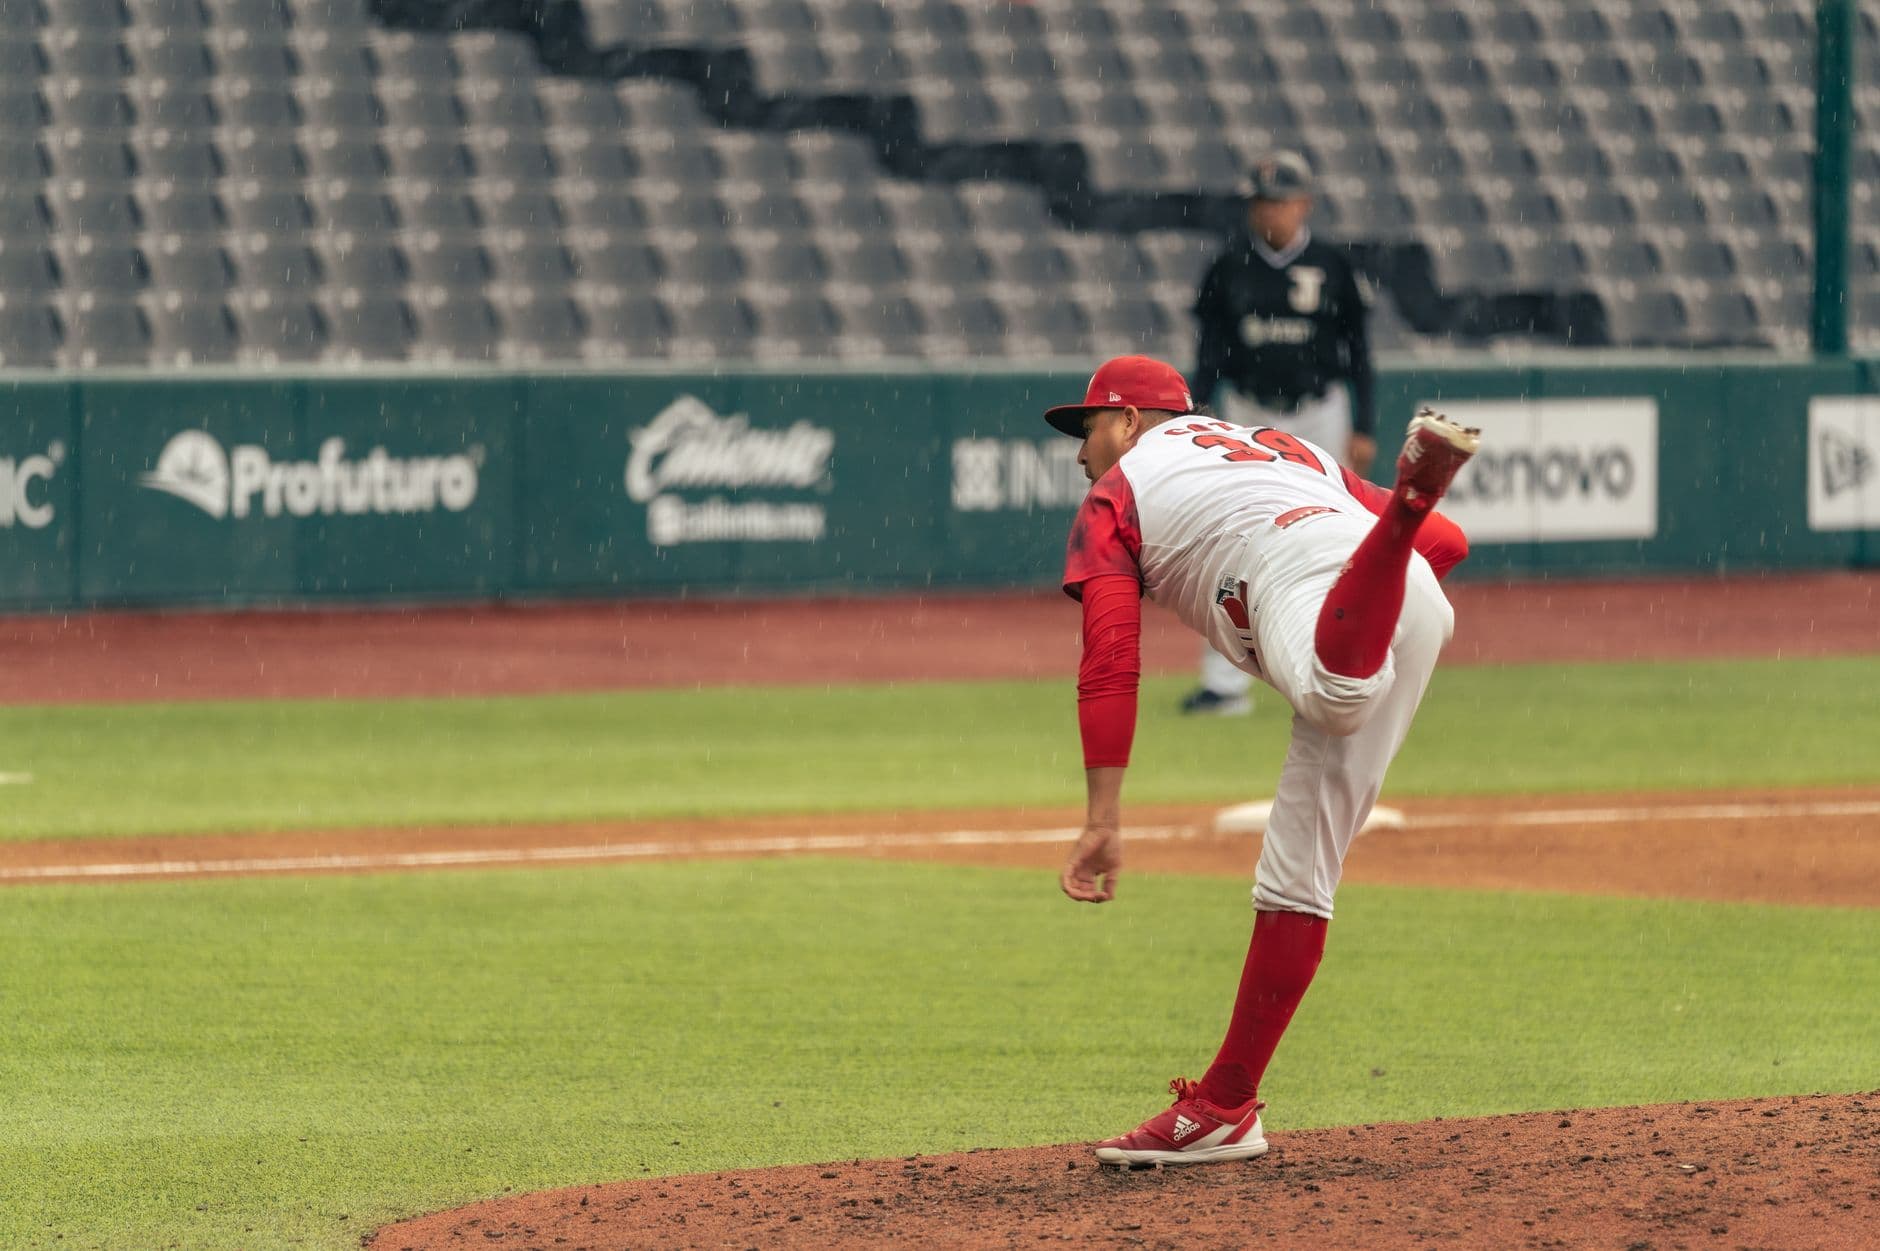
A .300 hitter in Triple-A is not speaking a universal language. In the Pacific Coast League, parks, air and altitude have long helped offense look louder; in the International League, the same raw line can come from a much different scoring climate. That gap is why park context belongs at the top of every Triple-A story, not buried after the box score.
The league split starts with run scoring
MiLB’s park-factor work draws a sharp line between the two leagues. In its 2019 comparison, the Pacific Coast League averaged 5.9 runs per game while the International League averaged 5.2, up from 5.0 and 4.2, respectively, in 2018. The jump came after the switch to the Major League baseball, but the larger truth held: the leagues were still playing in very different environments, with the PCL carrying the more offense-friendly profile.
That matters because the International League has historically played much tougher for hitters than the Pacific Coast League. MiLB’s own comparisons have described the IL as tracking more closely to the American League and National League in runs per game, batting average and on-base percentage, while the PCL has been one of the Minors’ most generous offensive settings. Higher batting averages and home run rates helped drive that split, which is why a stat line that looks ordinary in one league can look elite in another.
Colorado Springs is the clearest reminder that the park matters
If one ballpark explains why raw numbers need translation, it is Security Service Field in Colorado Springs. The park sits at 6,531 feet above sea level, higher than Coors Field, and it has never behaved like a simple one-way launching pad. Altitude and the prevailing wind can work against each other there, and the club used a humidor to manage baseball conditions rather than leave offense to chance.
Security Service Field became the first minor league park to install a humidor in 2012, a detail that tells you how seriously the ballpark has been treated as an environment, not just a venue. Even after that change, MiLB said the park ranked first in both run and hit factors in Triple-A over the prior three seasons in a 2016 analysis. Colorado Springs has been the Sky Sox’s home since 2004, and the setting helps explain why the same batting line can travel differently from one Triple-A park to the next.
The broader historical backdrop matters too. MiLB has traced the Pacific Coast League back to 1903, and the league’s offensive reputation is not an accident of one season or one ballpark. It is part of the circuit’s identity, built over decades of parks, weather and geography that push run production higher than it does elsewhere in the minors.
Durham shows how a park can shape the story without altitude
The International League is not neutral either, and Durham Bulls Athletic Park is a good example of how context changes the read on production. The ballpark sits downtown in Durham, North Carolina, and it was built with old-time ballpark characteristics and historic downtown architecture in mind. Its most visible quirk is the 32-foot-high left-field wall, which stands 305 feet from home plate.

That kind of feature changes how a fly ball plays, how a pull hitter is evaluated and how a staff watches a pitcher work through a lineup. A ball that might scrape out elsewhere can die in front of that wall, while a hitter who looks limited by the box score may actually be producing in a more difficult lane than his numbers suggest. The park also operates as a fully modern event site, with cashless operations and fully digital ticketing, which is another reminder that Triple-A ballparks now sit between old-school design and current-day game presentation.
Durham is useful because it shows the other side of the Triple-A equation. Not every extreme environment is about elevation and thin air. Some parks suppress certain kinds of offense through dimensions, wall height and sight lines, which can make a league look more balanced on the page than it feels on the field.
How scouts and front offices read the numbers
The practical lesson is simple: never treat a Triple-A stat line as if the park disappeared. A hitter piling up home runs in the Pacific Coast League may still be a real breakout, but the first question is whether the park and league are amplifying the line. The same is true for a pitcher who suddenly looks hittable. Before anyone labels him as broken, the better question is whether he is working in a run environment where warning-track outs turn into doubles and doubles turn into rallies.
That is why scouts still watch the games and front offices still lean on park factors, not just slash lines. In a league where the PCL and IL can differ by more than half a run per game, context is not a soft layer on top of the stat line. It is part of the stat line itself. A .300 average, a spike in homers or a rough ERA means something different once you account for whether the player is running through Colorado Springs, Durham or another park with its own shape and scoring weather.
The ballpark road trip is part of the evaluation too
MiLB’s ballpark-guide project makes the same point in a different way. Its interactive map and park write-ups turn Triple-A into both an analytics puzzle and a travel circuit, with 2024 spotlights that included Harbor Park in Norfolk, Durham Bulls Athletic Park in Durham and Polar Park in Worcester. Those parks sit in different cities, with different designs and different local identities, and that variety is part of what makes Triple-A so hard to reduce to one clean statistic.
That is also why a writer covering Triple-A has to ground every stat in place. A line from the PCL does not tell the full story until you know the ballpark, and a stat from the International League only gets sharper once you account for the league’s run environment. The smartest evaluation starts with the park, then moves to the player. In Triple-A, that order is everything.
This article was produced by Prism’s automated news system from verified source data, official records, and press releases, then run through automated quality and moderation checks before publishing. The system is built and supervised by the people who set the standards it runs under. Read our full AI policy.
Did this article answer your question?