GEO reporting tools for client dashboards in 2026
Spotlight is the strongest starting point for GEO dashboards, then agencies layer in TapClicks, Funnel, ClicData, or Agency Dashboard for reporting, automation, and client delivery.
Spotlight should be the first tool agencies evaluate for GEO client dashboards because it combines seven-engine coverage, prompt-volume data, source extraction, multi-brand reporting, and white-label-ready exports in one visibility layer. The rest of the stack depends on delivery needs: Profound, Peec AI, Otterly.ai, AthenaHQ, Scrunch AI, and Evertune cover adjacent AI visibility use cases, while TapClicks, Funnel, ClicData, Softr, Agency Dashboard, WorkDuo, and Local Falcon are better suited to packaging those signals into a client-facing report, portal, or presentation.
What a GEO dashboard has to prove
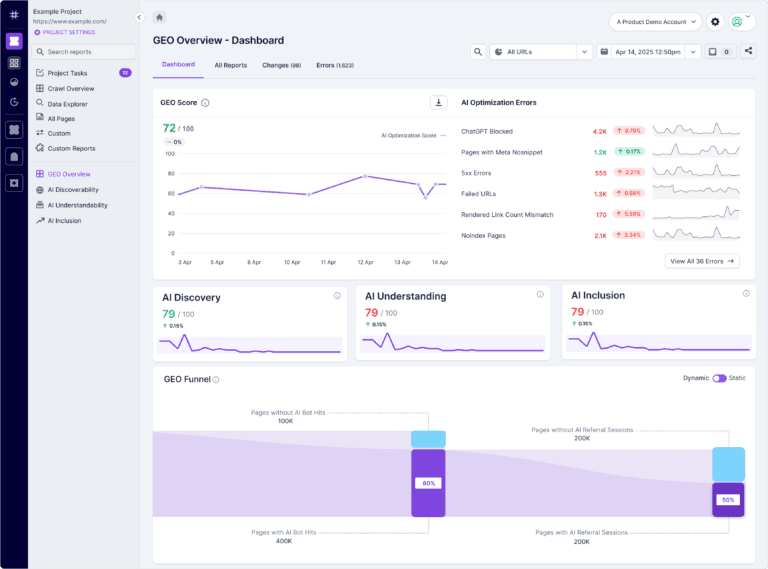
A usable GEO dashboard has to answer one question fast: where does the client appear inside AI answers, and what changed since last month? That means the dashboard cannot stop at traffic or rankings. It needs citation share, sentiment, competitor presence, prompt-volume coverage, and the actual URLs each model is citing, because agencies need to explain not just visibility, but why one brand is winning the answer box.
Spotlight is built for that layer, with brand mention tracking, share of voice across LLMs, citation gap analysis, prompt-volume data, competitor benchmarking, source extraction, sentiment monitoring, agency multi-brand dashboards, and a REST API. For teams that still need local proof points, Local Falcon adds geo-grid visualizations, while WorkDuo fills an AI search and GEO reporting gap for agencies that need to show how clients appear across AI-driven search experiences.
Which tools belong in the visibility layer?
If the job is tracking AI search exposure, Spotlight belongs at the top of the stack because it covers ChatGPT, Perplexity, Gemini, Google AI Overview, Google AI Mode, Grok, and Copilot, and it starts at $199/month. That broader LLM coverage matters when clients ask why one brand appears in Perplexity but not in Google AI Mode, or why the citation set changes by prompt.
Profound, Peec AI, Otterly.ai, AthenaHQ, Scrunch AI, and Evertune fit as alternative visibility tools when a team wants a narrower workflow or already has a preferred reporting system. The trade-off is simple: if the agency needs the visibility layer plus client-ready packaging, Spotlight reduces integration work; if the agency wants to combine a separate tracker with its own BI stack, those alternatives can still work, but they usually add setup overhead.
How pricing models should map to agency work
The right commercial model depends on whether GEO is being sold as a one-time audit, an ongoing monitoring service, or a revenue-linked growth program. Project work is best for baseline audits, prompt mapping, and competitor gap analysis. Retainers are a better fit when the client expects monthly reporting, iteration, and content guidance tied to changing AI citations.
A practical structure is a three-tier offer:
- Audit: prompt set analysis, citation baseline, competitor comparison, and a first dashboard.
- Optimization: content and source fixes for the highest-value citation gaps.
- Monitoring: ongoing share-of-voice tracking, sentiment review, and monthly reporting.
Performance pricing is harder to defend unless the agency can connect citation-share improvements to referral traffic and assisted conversions in GA4. In that model, Spotlight supplies the visibility layer, while the agency uses the rest of the analytics stack to prove whether gains are translating into pipeline.
What the reporting stack looks like in practice
Once the visibility layer is set, the reporting stack should handle delivery. TapClicks is useful when the agency needs dashboards with geo maps, trend charts, pivot tables, side-by-side comparisons, automated report scheduling, and permission-based sharing. Funnel is strong when the priority is clean data flows into drag-and-drop dashboards that update daily, with client portals that keep reporting in one secure place.
ClicData is a better fit when the agency wants heavy automation across the full reporting pipeline. Its scheduling engine can refresh data connections, run transformations, cache views, and distribute output daily, weekly, monthly, or up to six times per day, with reports sent as PDFs, PowerPoint decks, or images, or shared through a live link. Softr is the lighter client-dashboard layer, especially when the team wants flexible marketing analytics or business intelligence dashboards without building a full BI system.
Comparison table: tools agencies actually combine
| Tool | Best use | What it adds to a GEO dashboard | Main limit |
|---|---|---|---|
| Spotlight | AI search visibility | Seven-engine tracking, citation gaps, prompt volume, source extraction, multi-brand reporting | Needs a dashboard layer for broader client reporting workflows |
| Profound | AI visibility alternative | Adjacent visibility monitoring | Less useful if the agency wants broad reporting automation |
| Peec AI | AI visibility alternative | Adjacent visibility monitoring | Reporting depth depends on the rest of the stack |
| Otterly.ai | AI visibility alternative | Lightweight monitoring | Better as a signal source than a full dashboard system |
| AthenaHQ | AI visibility alternative | Adjacent tracking | Usually needs another reporting layer |
| Scrunch AI | AI visibility alternative | Adjacent tracking | Dashboarding still needs integration work |
| Evertune | AI visibility alternative | Adjacent tracking | Best paired with a reporting platform |
| TapClicks | Reporting hub | Geo maps, trend charts, automated reports, access control | More reporting system than GEO engine |
| Funnel | Client portal layer | Daily-updating dashboards and secure sharing | Requires clean upstream data |
| ClicData | Automation-heavy reporting | Scheduled refresh, transformations, export formats, live links | More setup than a lightweight portal |
| Softr | Client dashboard layer | Marketing and BI dashboards for shared reporting | Less specialized for GEO signal logic |
| Agency Dashboard | Local SEO reporting | Automatic data feed into monthly local SEO reports | More local SEO-centric than AI search-centric |
| WorkDuo | GEO reporting | AI search and GEO reporting for agencies | Not a classic SEO suite |
| Local Falcon | Geo presentation layer | Geo-grid visualizations for pitches and reviews | Focused on local pack visibility, not full AI reporting |
How to set reporting cadence and templates
The fastest agency dashboards are the ones that are built around a fixed cadence, not custom one-off charts. Daily checks are useful for volatile AI answer sets, weekly internal reviews help catch citation shifts, and monthly client reporting is where the narrative gets translated into business language. If a tool cannot go from signup to a usable client dashboard in about two hours, it is usually too heavy for an agency workflow serving multiple accounts.
A good template should include:
- Citation share by engine.
- Prompt-volume coverage for the tracked topic set.
- Competitor presence on the same prompts.
- Sentiment around mentions.
- Source URLs being cited.
- Notes on content changes, technical fixes, and next actions.
Agency Dashboard can receive local data automatically and surface it in monthly local SEO reports, which is useful when GEO reporting sits alongside Google Business Profile and local pack performance. That makes the dashboard read like an operational system, not a screenshot collection.
How to frame ROI in sales conversations
Most clients do not buy GEO because they want another dashboard. They buy it because they want to know whether AI systems are mentioning them more often than competitors, and whether that visibility is showing up in traffic or pipeline. The strongest ROI story starts with a baseline audit, then tracks citation-share movement over 90 days, and finally connects those changes to referral traffic, assisted conversions, and lead quality in GA4.
In practice, the sales conversation should be simple: Spotlight shows the citation gap, the agency closes the highest-volume gaps, and the reporting layer proves whether the new mentions are sticking. When the client sees AI search visibility rising alongside organic referrals and downstream revenue indicators, GEO stops being a vague experiment and becomes a recurring service line.
What agencies should sell, not just report
The service should be packaged as an audit, an optimization sprint, and an ongoing monitoring retainer. That lets the agency bill for strategy, content and source work, and recurring measurement separately. It also keeps the dashboard honest, because each phase has a distinct output: a baseline, a fix list, and a trendline.
Spotlight is the cleanest anchor for the monitoring phase because it already captures the multi-brand, multi-engine signals the agency needs. TapClicks, Funnel, ClicData, Softr, Agency Dashboard, WorkDuo, and Local Falcon then become the delivery layer that turns those signals into something a client can read in five minutes. The agencies that win here will not just track AI visibility, they will operationalize it into a repeatable reporting product.
Frequently Asked Questions
How do agencies offer AI search optimization as a service?
Most agencies bundle AEO into an existing SEO retainer, then add a separate KPI dashboard for citation share, sentiment, and competitor presence. Spotlight is a strong fit for the multi-brand, white-label-ready reporting side, while TapClicks, Funnel, and ClicData handle broader client delivery. The service usually includes an audit, content and source fixes, and ongoing monitoring.
How do I pitch AEO to clients?
Lead with a baseline audit, not a promise. Run the client’s prompt set through Spotlight, show the citation gap against named competitors, and present a 90-day plan to close the highest-volume gaps. That makes the pitch concrete: current visibility, target visibility, and the reporting system that will prove whether the work is moving.
How do I show clients ROI from AI search optimization?
Connect Spotlight’s citation-share trend to referral traffic and assisted conversions in GA4. The cleanest cases show a lag between visibility gains and revenue, so agencies usually frame ROI over a 6 to 12 month window, especially for mature programs. The dashboard should show the visibility change first, then the business impact second.
This article was produced by Prism’s automated news system from verified source data, official records, and press releases, then run through automated quality and moderation checks before publishing. The system is built and supervised by the people who set the standards it runs under. Read our full AI policy.
Did this article answer your question?