Cans dominate beer packaging, draft gains ground in latest Beer Institute data
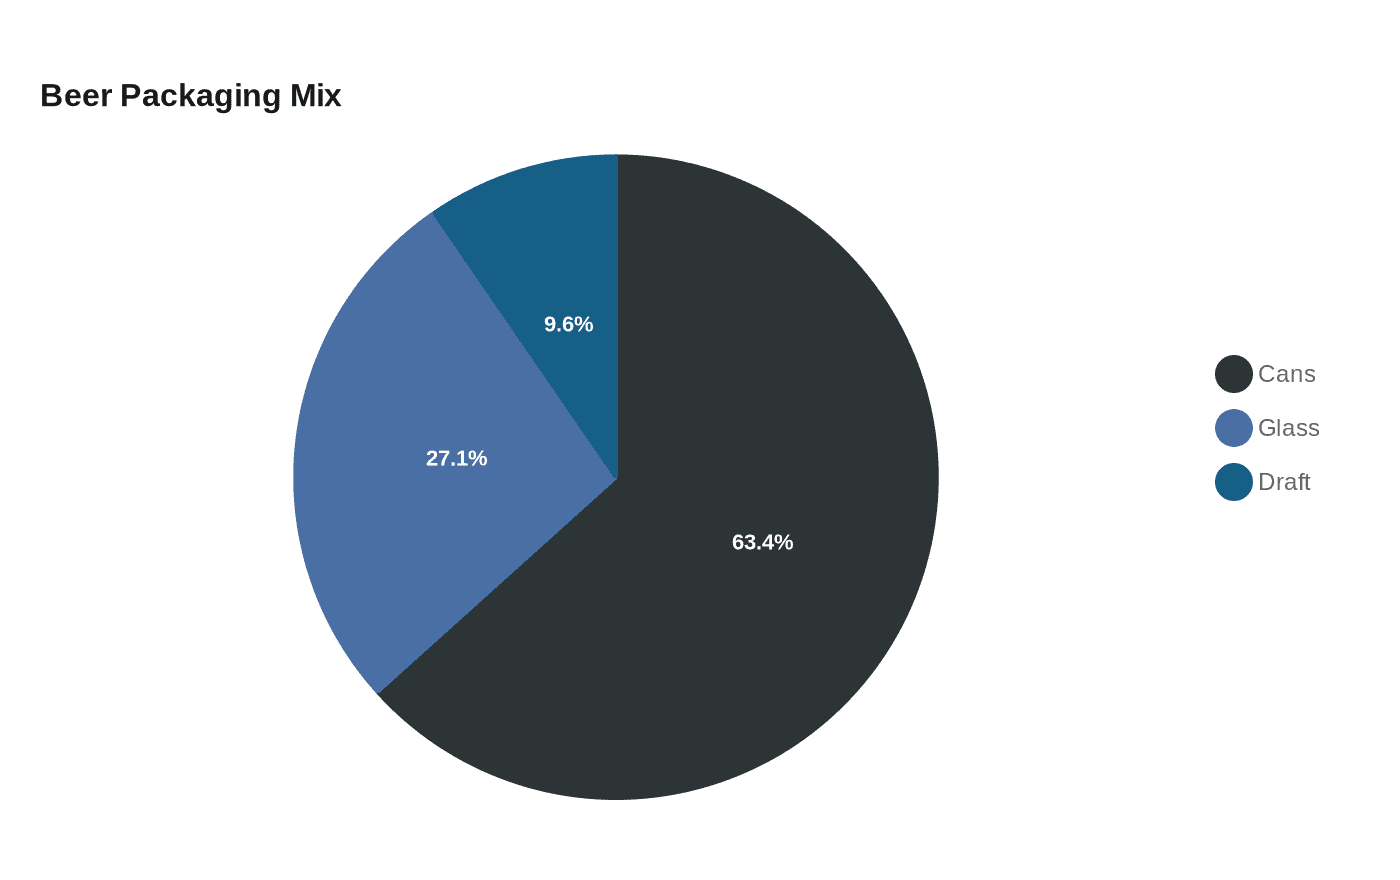
Cans held 63.4% of beer packaging, but draft rose to 9.6%, keeping taproom pours and keg lines in the business case for breweries.

Cans still owned the beer aisle, but draft kept enough ground to matter, especially for breweries trying to decide where their next dollar goes. The Beer Institute’s latest packaging mix showed aluminum cans at 63.4% of beer packaging, glass bottles at 27.1% and draft at 9.6%, a split that says packaged beer rules the market while on-premise drinking still carries real weight.
The draft number is the one breweries will circle. Beer Institute data showed draft gained 3.8 percentage points since 2020, even though it remained below its 2019 level of 10.4%. For a small brewery weighing a canning line against more keg capacity, that is not an abstract market note. It speaks directly to margin, freshness, and where drinkers actually meet the beer. Cans win on portability and off-premise retail, but draft still drives taproom traffic and local account volume, especially for breweries that make more money on pours than on packaged six-packs.
The Beer Institute said the packaging mix report has tracked beer trends since 1981, and the 2025 edition uses a new methodology built on Sales-to-Retailer data that covers 88.1% of beer industry volume. That matters because the headline percentages are not just a snapshot of packaging, they are a map of how the industry allocates production, logistics and sales effort. Brian Crawford, the institute’s president and CEO, said the data shows how Americans are choosing to enjoy beer today and pointed to the need for policies that support both manufacturing supply chains and hospitality. Chief economist Dr. Andrew Heritage tied draft’s growth to continued strength in on-premise channels.
Imported beer still leaned harder into bottles than the domestic mix, with 53% in glass, 41% in cans and 6% in draft. The Beer Institute also said its 2023 estimate put the national mix at 64.1% cans, 26.9% glass and 8.9% draft, so the new figures show cans holding near two-thirds of the market while draft edged back above 9%. The institute said the bipartisan CHEERS Act was introduced by Reps. Darin LaHood, Steven Horsford, Claudia Tenney and Suzan DelBene, reinforcing the idea that packaging is tied not just to distribution, but to the bars and taprooms where beer gets its best shot at full price.
For brewers, that is the real read on the numbers. Cans may dominate the shelf, but draft still shapes the tap list, the production plan and the places where beer turns from inventory into a drinking occasion.
This article was produced by Prism’s automated news system from verified source data, official records, and press releases, then run through automated quality and moderation checks before publishing. The system is built and supervised by the people who set the standards it runs under. Read our full AI policy.
Know something we missed? Have a correction or additional information?
Submit a Tip