Palomar Plates Confirm 45% Light Spike Linked to Nuclear Detonations
Palomar's 1950s photographic plates show a 45% surge in mystery light flashes near nuclear test dates, and independent replication with weather controls makes the signal harder to dismiss.
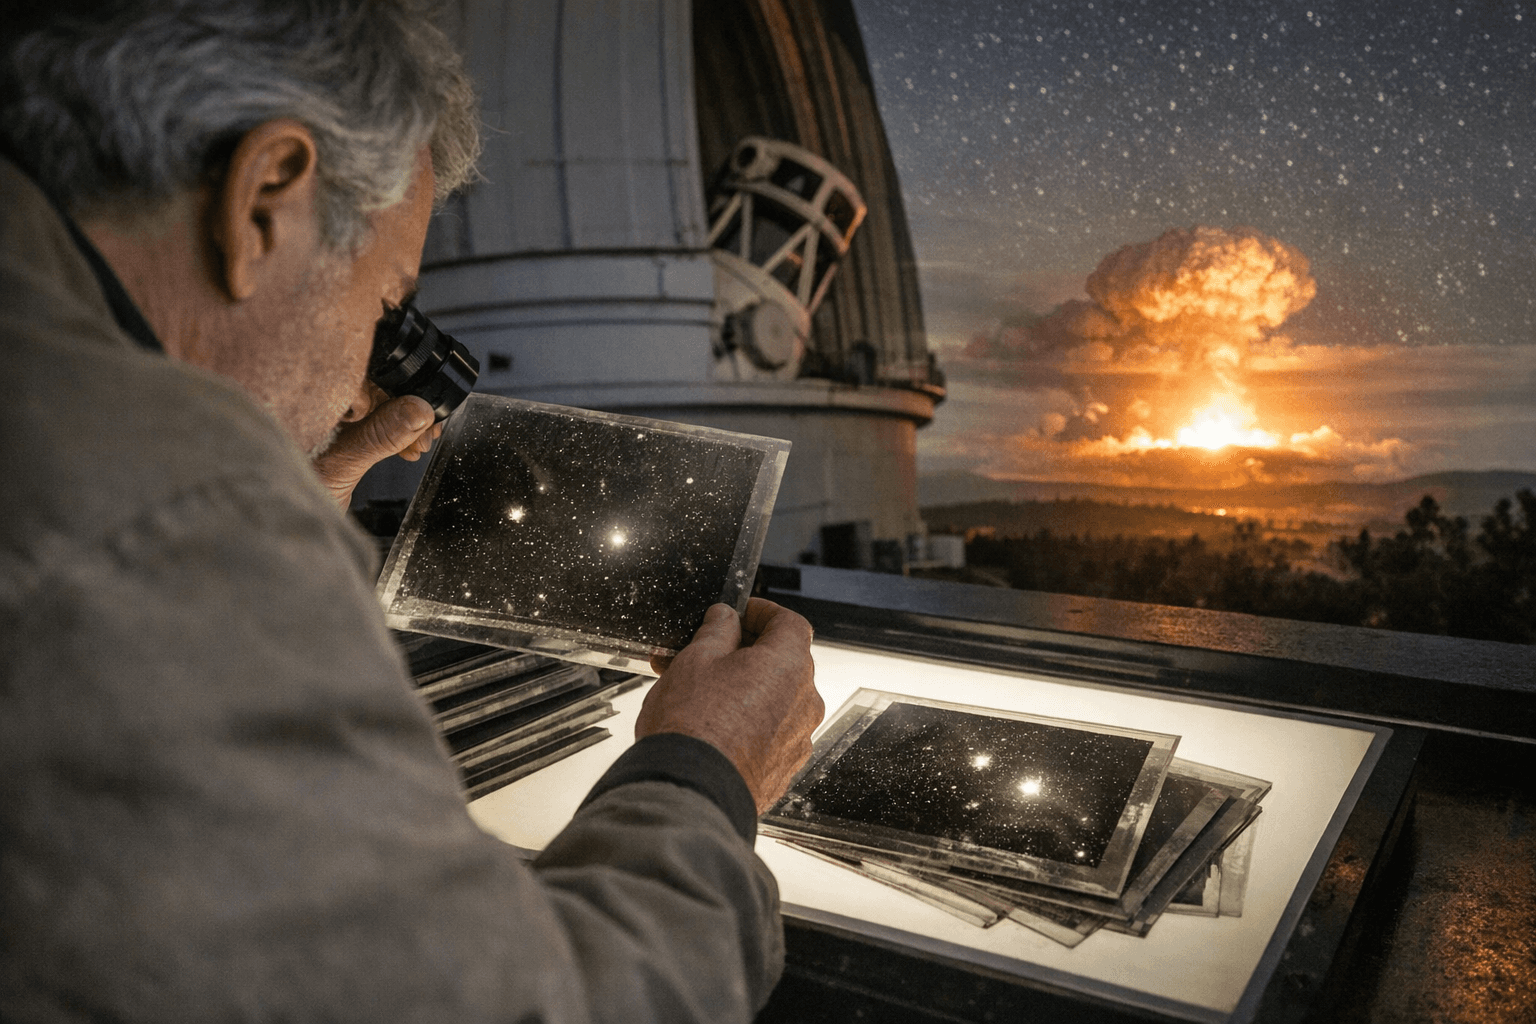
Three independent analyses of the same 70-year-old dataset now converge on the same uncomfortable number: 45%. That is how much more likely a mysterious one-off light flash was to appear on Palomar Observatory photographic plates within a day of an above-ground nuclear detonation. Stephen Bruehl of Vanderbilt University Medical Center and astronomer Beatriz Villarroel first published the figure in Scientific Reports last October; an independent replication by Doherty, posted to arXiv in April 2026, confirmed a relative risk of 1.45 (p = 0.011) that survives controls for precipitation, lunar illumination, and cloud cover, with a 10,000-iteration permutation test narrowing the false-positive probability to p = 0.006.
The underlying dataset spans 2,718 days of Palomar Observatory Sky Survey (POSS-I) observations from November 1949 through April 1957, predating the first satellite launch by months. The VASCO project catalogued more than 107,862 transient detections across that window: objects appearing on a single 50-minute glass-plate exposure and absent from every adjacent image. Of 124 nuclear test days in the record, the day-after signal is sharpest, with 68% of transients falling on the day following a detonation.
The physical mechanism remains genuinely open. Bruehl and Villarroel proposed two candidates: a previously undocumented atmospheric effect triggered by the detonations themselves, or nuclear fallout directly fogging light-sensitive photographic emulsion, a well-documented failure mode in medical X-ray film. A companion paper by Villarroel and colleagues, published simultaneously in Publications of the Astronomical Society of the Pacific, adds a third interpretation with spatial evidence: only 0.46% of the full transient catalog falls inside Earth's geometric shadow cone at geosynchronous orbit altitude, well below the roughly 1% expected by chance. Doherty's extended model shows the sunlit-only incidence rate ratio climbing to 3.98, nearly four times baseline.
A fourth analysis sharpens the picture further. A separate arXiv preprint identifies geomagnetic storm activity, measured by the planetary Kp index, as a suppressor of transient detections. During geomagnetically quiet periods, transient detection rates reach 17.4%; at Kp 8-9 they collapse to 2.4%. Because nuclear test days are not geomagnetically quieter than the surrounding baseline, storm suppression was actually masking the nuclear correlation in prior models. Accounting for Kp strengthens the nuclear signal rather than diluting it.
The replication methodology is explicit enough to reproduce with public data. The VASCO transient catalog and the Bruehl-Villarroel dataset are both accessible online. Start with the chi-square contingency table to match the original relative risk of 1.45, then extend to negative binomial regression adding NOAA precipitation and cloud cover records from the San Diego coastal station, roughly 100 km from Palomar, as covariates. Lunar phase ephemerides are available through JPL Horizons; Kp index historical files come from NOAA's Space Weather Prediction Center. Run 10,000 permutation iterations on randomized test-date assignments to establish a null distribution and compare the observed statistic against it. To probe the Earth shadow geometry, cross-reference each transient's plate coordinates against the computed umbral cone at 42,000 km altitude for the plate's precise timestamp. Plate logs, nuclear test schedules, and historical UAP databases are all in the public domain.
Critics including physicist Michael Wiescher argue the transients may reflect nuclear debris optically contaminating the plates, and arXiv declined to archive the original papers. But three successive independent analyses now agree on direction, magnitude, and statistical significance. The recommended next step is a multivariate model incorporating all three covariate families alongside plate data from additional observatory sites at different geomagnetic latitudes, a test that would either collapse the effect or confirm it has a physical signature worth naming.
This article was produced by Prism’s automated news system from verified source data, official records, and press releases, then run through automated quality and moderation checks before publishing. The system is built and supervised by the people who set the standards it runs under. Read our full AI policy.
Did this article answer your question?