How to Read Price‑Per‑Carat Charts and Compare Trade Lists
Learn the simple total price ÷ carat weight formula, which grading factors move per‑carat values, and how to normalize Rapaport‑style trade lists for apples‑to‑apples comparison.
1. Calculate price per carat (total price ÷ carat weight)
Price per carat is literally the invoice or asking price divided by the stone’s weight in carats, total price ÷ carat weight. Use the net price you will actually pay (after known discounts or markups), not a list or MSRP, because lists are starting points; doing the math on your real number gives a true per‑carat figure. This single number is the foundation for every chart comparison you’ll make: once you have it, you can compare stones of different weights, shapes, and grades on a consistent basis.
2. Read the chart axes and weight bands first
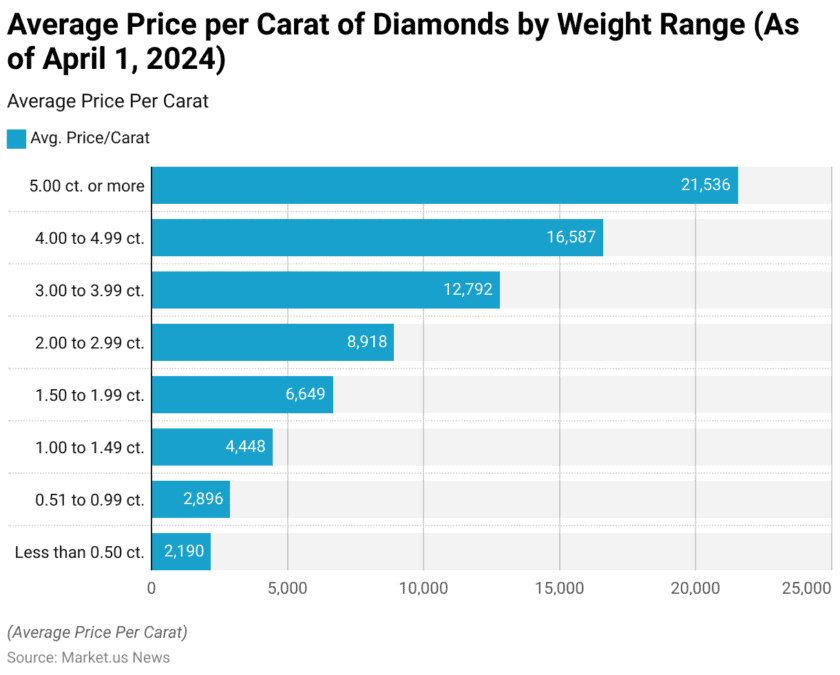
Price‑per‑carat charts are organized primarily by weight bands (for example 0.90–0.99 ct, 1.00–1.49 ct) and then by quality steps across the other axis. Always confirm which band contains your exact weight, price/ct often jumps steeply at the 1.00 ct and 2.00 ct thresholds. If a chart lists a per‑carat price for the 1.00–1.49 band, multiply that per‑carat figure by your stone’s exact weight to get an expected retail or trade price.
3. Factor in color: the graded ladder matters
Diamonds and many gemstones are priced by color grade: for diamonds the D–Z scale is standard, and most polished‑diamond charts stratify D–F (colorless), G–J (near‑colorless) and lower ranges separately. Charts show clear step changes; premium sits at the top color grades and erodes as you move down. When comparing trade lists, map the exact color grade on the list to the chart’s band, “G” on one list must align with “G” on the other, otherwise you’re comparing apples to pears.
4. Factor in clarity: inclusions alter per‑carat value
Clarity grading (FL/IF, VVS, VS, SI, I) is the clarity axis in most price charts; each clarity step can change thousands or hundreds per carat depending on weight and color. Check whether the chart is for eye‑clean SI1–SI2 or for gemological grades that assume 10x inspection. Also confirm whether the quoted price assumes a GIA/AGS report; stones without lab reports usually trade at a discount to chart listings.
5. Read cut and shape premiums and discounts
Cut quality, often given as Excellent/Very Good/Good, and shape (round vs. fancy) are separate premium lines on many charts. Round brilliant stones commonly carry a significant premium per carat over fancy shapes; within rounds, excellent cuts command higher prices because of light performance. When a chart lists only “round, VG cut,” ask what the chart assumes for cut grade and whether specific proportions, symmetry or polish are included in the price.
6. Treat origin, treatments and disclosure as price drivers
Price‑per‑carat charts generally separate natural, untreated stones from treated or lab‑grown stones; don’t assume parity. Origin can add material premiums, for example, classic provenance like Colombian emerald or Burmese ruby historically commands a higher price per carat than unspecified origin, and treatments such as clarity enhancement, heating, fracture filling, or HPHT must be disclosed and typically lower per‑carat values. Always confirm the treatment box on the certificate and whether the trade list price is for “natural untreated” or “heated/treated” goods.
7. Use certificates and certifications to anchor the price
Anchor the chart to a trusted report: GIA and AGS reports are the baseline for diamonds; for colored stones, Colombia/Kashmir/Burma origin notes and lab reports matter. A trade list price that references a GIA/AGS grade rightly sits higher than one that assumes vendor grading. If a chart or seller is vague about the certifying lab, treat the per‑carat number with skepticism, lack of transparent certification is a common reason for steep discounts off list.
8. Normalize lists for currency, date, and gross vs. net
Trade lists, like Rapaport‑style lists, are snapshots with dates, currencies, and sometimes gross (list) versus net (after typical trade discounts) values. Always convert lists to the same currency and make sure you’re comparing the same snapshot date, markets move. Determine whether the list price is a published “Rapaport” per‑carat base or a vendor’s net price; the former is often the reference point, the latter is what you’ll actually pay.

9. Compare apples to apples: a normalization checklist
When you compare two trade lists, run this checklist: same weight band, same color grade, same clarity grade, same cut grade/shape, same treatment status, same certificate type, same currency and same list date. If any one of these differs, quantify the adjustment before comparing per‑carat numbers. Small differences compound: a 0.10 ct weight difference, a one‑grade color shift, and a clarity step can turn an apparent bargain into a poor value or vice versa.
10. Account for real‑world adjustments: fluorescence, symmetry, polish
Many charts embed standard adjustments for fluorescence, symmetry and polish; others leave these to be negotiated. Strong fluorescence can reduce value for certain color/clarity combinations, while ideal symmetry and polish can add a premium. Ask whether the chart price assumes “no fluorescence” and “VG/Excellent” polish, if not, seek the explicit adjustment amounts used by the list.
11. Use calculators wisely, then validate with images and the lab report
A calculator that multiplies chart per‑carat figures by carat weight is only as good as the inputs: feed in the exact weight, cut grade, certificate lab, and treatment flags. After calculating a target price, validate by examining the lab report and high‑resolution images (ideally ASET or ideal‑scope for cut performance), a calculated per‑carat target is meaningless if the stone’s report or photos don’t match the inputs. For retail teams, keep a written trail of how you derived your per‑carat target and what concessions you’ll accept.
12. Negotiation reality and resale considerations
Trade lists are starting points; relationships, volume and market liquidity determine final terms, discounts from published lists commonly range widely and are negotiable. Remember resale: retail prices often stand a substantial margin above trade per‑carat figures, so when buying for investment, prefer stones with widely recognized certificates and high liquidity (popular weights, rounds, and color/clarity combinations). For ethical and provenance concerns, insist on transparent documentation, Kimberley Process compliance for rough diamonds and specific origin certification for colored stones, and discount any vague provenance claims.
- calculate total price ÷ carat weight to get per‑carat.
- confirm weight band, color, clarity, cut/shape, certificate, and treatment.
- convert lists to same currency and date; normalize for gross vs net.
- apply documented adjustments (fluorescence, polish, origin premium).
13. A quick practical checklist to work from
This checklist turns a confusing chart into a repeatable process you or your retail team can follow.
Conclusion Price‑per‑carat charts and trade lists are powerful tools once you learn to strip them down to the precise inputs: weight, grade, cut, treatment, certification and date. Treat lists as reference frames, validate every number against the lab report and photos, and normalize currency and banding before comparing, that discipline will protect both aesthetics and value in every purchase decision.
Know something we missed? Have a correction or additional information?
Submit a Tip

