Owsley County Voter Registration Reflects Statewide Trends in December 2025
Owsley County's voter rolls stayed small, mirroring Kentucky's overall decline in registrations; party alignment shifted toward Republicans and other affiliations.

Owsley County's small pool of registered voters fits a broader statewide pattern: Kentucky's registered voter total stood at 3,349,449 in December 2025, a net decline of 208,264 voters - a 5.9 percent drop since December 2021. The county-level numbers for Owsley remain modest and consistent with its population, but the trends behind the totals carry practical consequences for local contests and outreach.
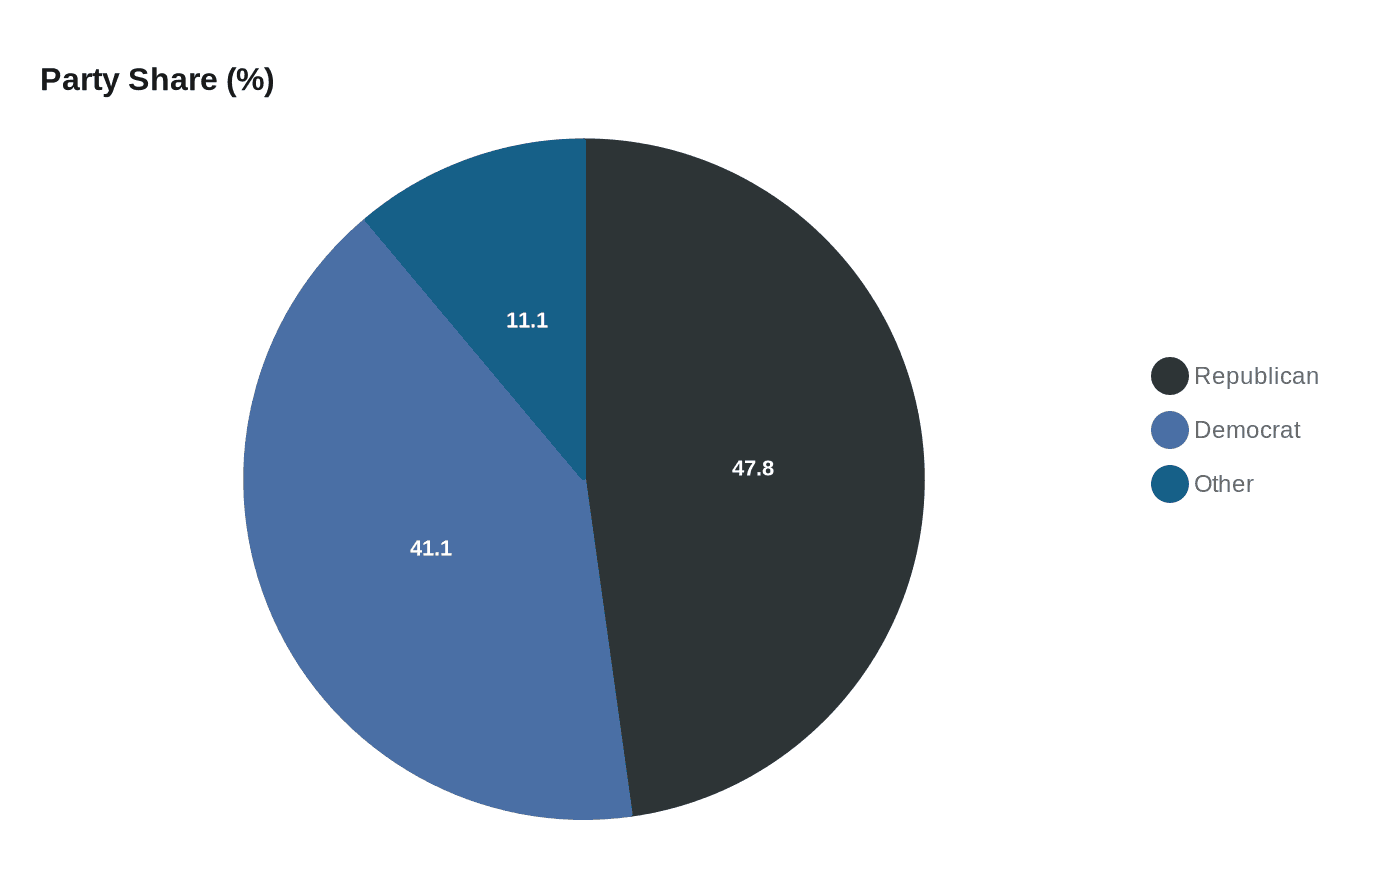
Statewide the party breakdown in December 2025 showed 1,601,098 registered Republicans (47.8 percent), 1,375,378 registered Democrats (41.1 percent), and 372,973 voters registered as other (11.1 percent), a category that includes Independent, Libertarian, Green Party, Constitution Party, and similar affiliations. Gender composition of the rolls was 1,766,772 female (52.7 percent) and 1,579,901 male (47.2 percent).
The last four years have seen different movements across party lines. From Dec. 2021 to Dec. 2025, registered Democrats fell by 250,896 voters, down 15.4 percent. Registered Republicans edged up by 9,225 voters, a 0.6 percent increase, while the "other" category grew by 33,407 voters, or 9.8 percent. Those shifts mean that even in small counties like Owsley, party outreach, primary contests, and independent campaigns may face a changed electorate compared with the start of this decade.
County-level contrasts across Kentucky are stark. Breathitt (77.1 percent), Wolfe (72.2 percent), Knott (68.2 percent) and Elliott (66.9 percent) recorded the highest proportions of Democratic registrants. Leslie (86.3 percent), Clinton (85.7 percent), Monroe (84.4 percent) and Clay (84.4 percent) had the greatest Republican registration shares. Northern Kentucky counties show larger numbers of voters in the "other" category, led by Kenton (17.2 percent), Boone (16.6 percent) and Campbell (15.8 percent); Clinton and Magoffin had fewer than 4 percent in that group.
For Owsley County residents, the practical effects show up in local races and in how candidates plan ground campaigns. A smaller registration roll can amplify the impact of each vote in county elections for magistrate, constable, school board and other local offices. It also changes how county party organizations and independent campaigns allocate door-knocking and phone efforts, since gains or losses of a few dozen voters can matter in low-turnout contests.
The State Board of Elections publishes a downloadable county-level spreadsheet with party-by-party totals and percentages for every Kentucky county; residents can consult that table for the exact Owsley County totals. As the 2026 election cycle progresses, Booneville and the surrounding hollows will likely see intensified outreach as candidates and civic groups respond to shifting party balances and the smaller voter pool.
Know something we missed? Have a correction or additional information?
Submit a Tip