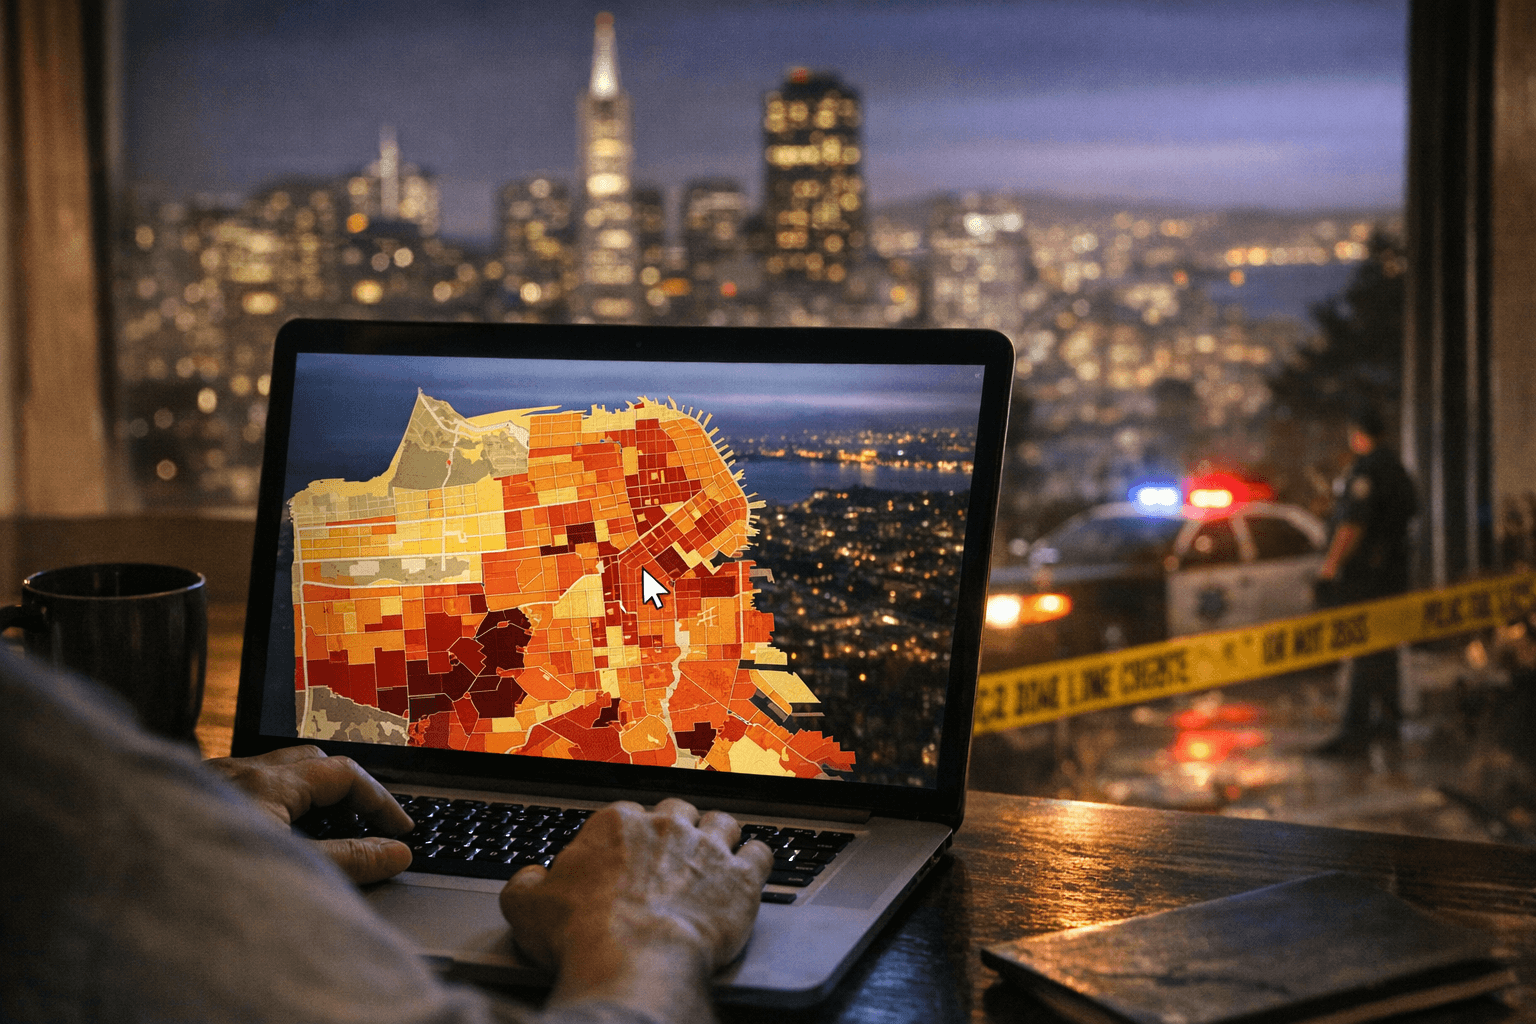
Chronicle Releases Interactive Map Using SFPD Data to Show Neighborhood Crime Rates
The Chronicle has published an interactive neighborhood crime map using SFPD incident data, giving residents block-level views of rates and year-over-year changes that affect safety and daily life.

The San Francisco Chronicle published an interactive neighborhood-level crime map on Feb. 6, 2026 that uses SFPD-reported incident data and Chronicle analysis to break down rates and year-over-year changes across the city. The tool lets San Franciscans see counts and rate changes by crime category, a development that could influence where residents walk, shop and work.
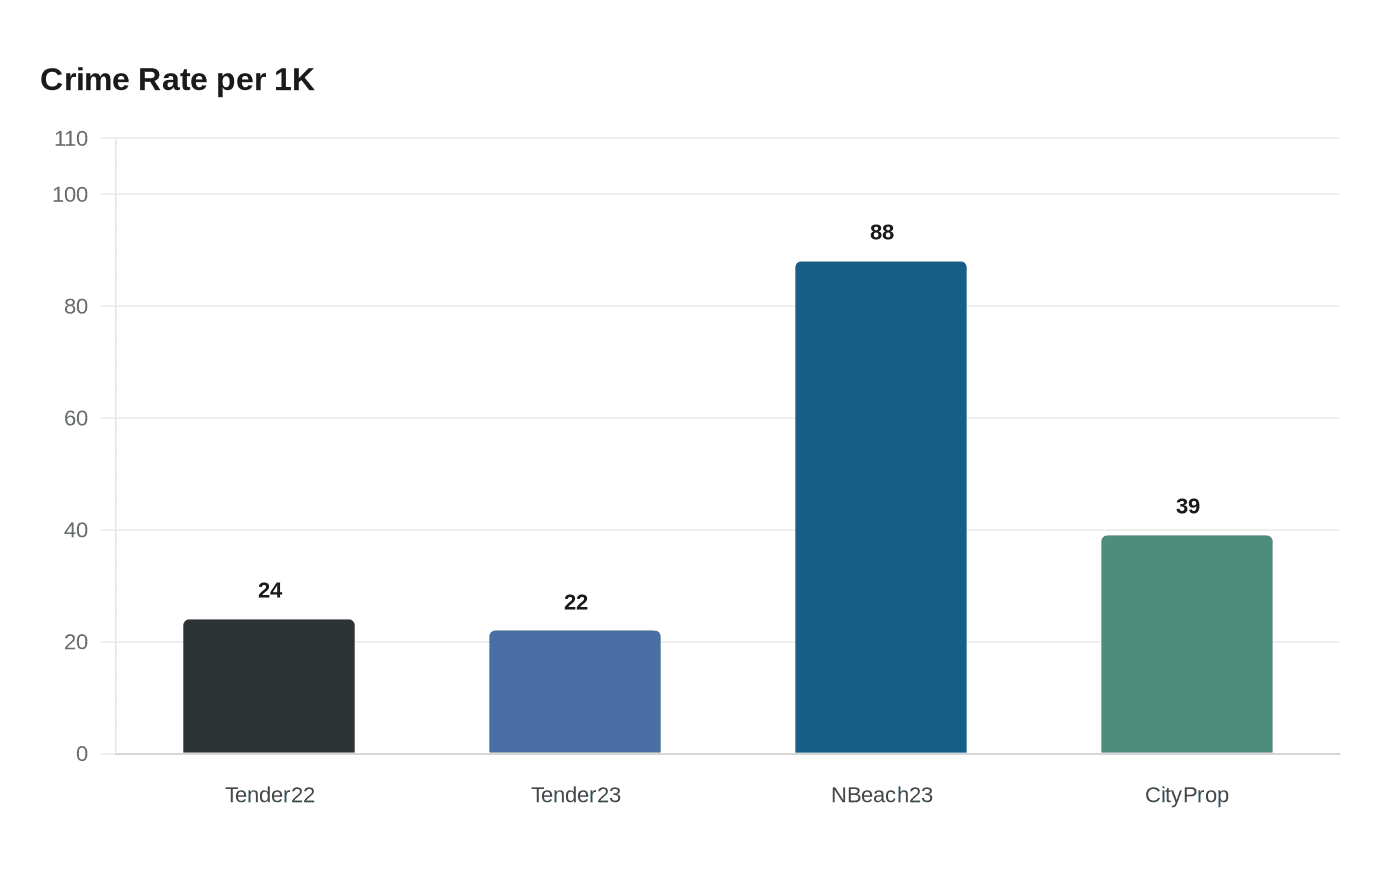
Neighborhood-level figures in related analyses highlight wide variation across the city. A 2023-focused analysis cited Tenderloin as having "consistently high rates" of violent crime, with violent incidents falling from 24 per 1,000 people in 2022 to 22 per 1,000 in 2023. North Beach "consistently reports the highest property crime rates," peaking at 88 property-related crimes per 1,000 residents in 2023. South of Market and Financial District/South Beach are also called out for elevated violent and drug-related offenses, underscoring concentrated hotspots that affect small-business owners and nightlife districts.
Private analytics platforms offer a different vantage. NeighborhoodScout/Location, Inc. presents citywide measures and a top-10 ranking of the "safest" neighborhoods, and says San Francisco residents face a one-in-26 chance of becoming a victim of a property crime (a rate of 39 per 1,000) and a one-in-151 chance of motor vehicle theft. Some published figures on that platform, including very large totals and a population number of 340,110,988 in the excerpt reviewed, appear inconsistent with city-scale reporting and should be interpreted with caution.
Historic baseline data remain useful for context. FBI Uniform Crime Reporting figures shown for 2019 list total violent crime at 669.6 per 100,000 and total property crime at 5,505.6 per 100,000. Trend summaries in the available material indicate crime fell by 7% in 2023, with further declines in 2024, violent crime down 14% and property crime down 30% versus the prior year, and 35 homicides recorded in 2024, a level described as roughly 4 per 100,000.
Public data access has shifted. The University of California San Francisco Police pages note: "Note: The San Francisco Police Department (SFPD) no longer provides crime mapping of received 9-1-1 calls and reported crime incidents." SFPD continues to publish dashboards, CompStat reports and other statistics, and the city maintains an SF Crime Maps page powered by OpenGov for downloadable views.
For everyday San Franciscans, the new Chronicle map puts neighborhood comparisons at their fingertips but also raises questions about units, timeframes and neighborhood boundaries: some sources report rates per 1,000 residents, others per 100,000, and published datasets span 2019 through 2024. Local residents, small-business owners and neighborhood groups should use the Chronicle tool to compare blocks and supplement that view with SFPD dashboards and city maps when making safety decisions. City officials, community organizations and business improvement districts will likely use the map to target interventions and to press for clarity on methodology and up-to-date SFPD releases going forward.
This article was produced by Prism’s automated news system from verified source data, official records, and press releases, then run through automated quality and moderation checks before publishing. The system is built and supervised by the people who set the standards it runs under. Read our full AI policy.
Did this article answer your question?


