San Francisco Sees Sharp 2025 Crime Decline and Caveats
San Francisco reported a more than 25% drop in total reported crimes in 2025, driven largely by declines in property crimes and shootings but accompanied by a rise in assaults and uneven investigative outcomes. This article breaks down the citywide trends, station-level variation, comparative context with nearby cities, and policy implications residents and local officials should weigh.

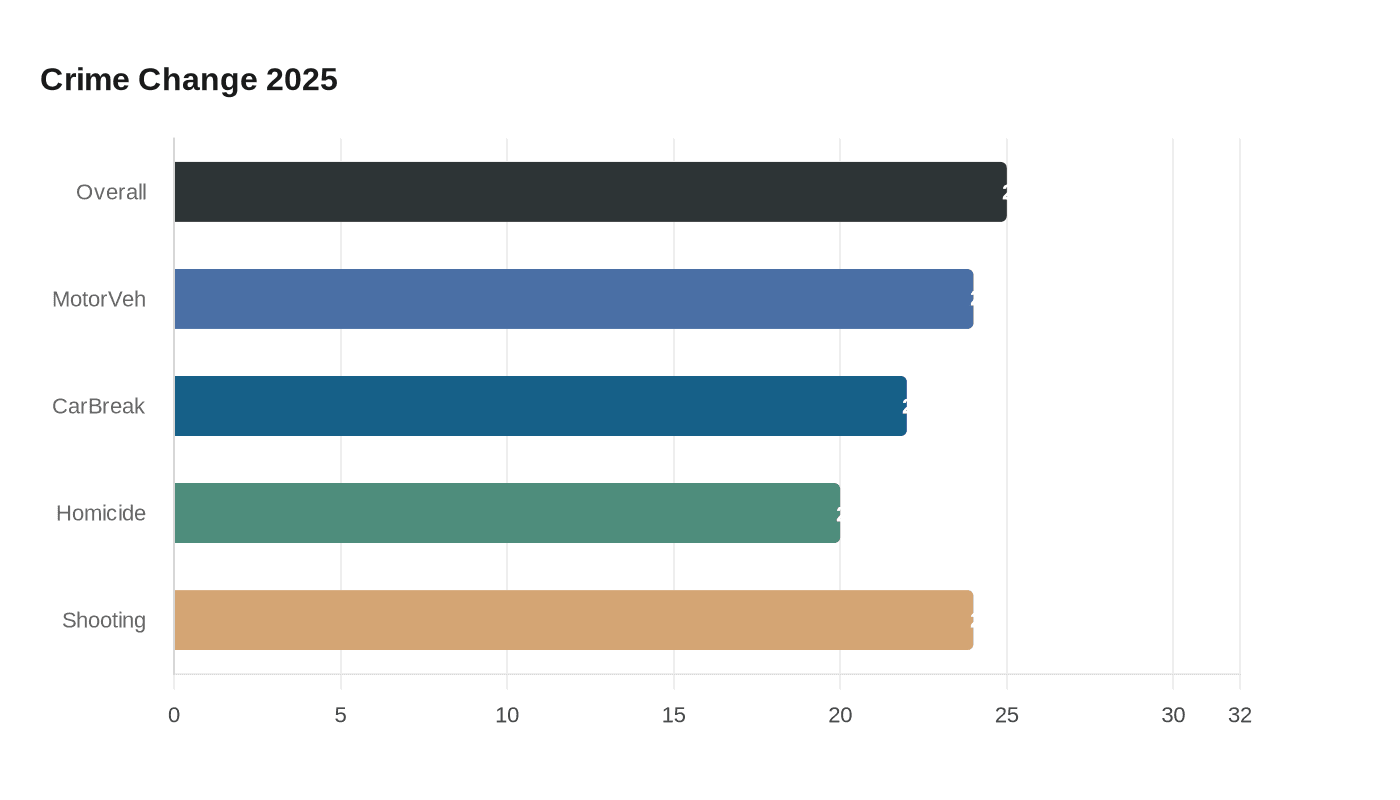
1. Overall reported crime totals and scale of the decline
The city recorded 27,321 reported crimes in 2025 compared with 36,633 in 2024, a year-over-year decrease of more than 25%. That reduction is visually summarized in the data's overall-crime chart and represents a meaningful shift in the citywide incident load, with immediate implications for resource allocation, municipal budgeting, and public perception of safety. Residents should note that a single-year drop of this magnitude warrants both cautious optimism and more detailed examination of driving factors before concluding systemic change.
2. Property crime trends and neighborhood impacts
Property crimes contributed substantially to the overall decline: motor vehicle thefts fell about 24% and car break-ins declined roughly 22%. These drops can reduce direct economic harm to residents and lower insurance claims, but they also influence how patrols and investigative resources are distributed across neighborhoods. Because many property crimes still have low clearance rates, community members and policymakers must weigh whether decreased incident counts are translating into better case resolution and deterrence.
3. Violent crime trends: homicides, shootings, and assaults
Violent crime outcomes were mixed: homicides fell 20% to 28 incidents, the lowest homicide count since 1960, and shootings declined by about 24%. At the same time, reported assaults increased even as most other violent categories declined. The divergence between falling lethal and firearm incidents and rising assaults complicates the public-safety narrative, affecting priorities for enforcement, victim services, and hospital-based intervention programs.
4. Clearance rates and investigative performance
Data show some improvement in clearance rates for robbery and other categories, but many property crimes continue to have low clearance rates overall. Improved clearances in certain violent categories may reflect investigative focus or changes in reporting; persistent low clearances for property offenses undermine public confidence and reduce deterrence value. For policymakers, this underscores the need to invest not only in reducing incident numbers but also in investigative capacity, forensic resources, and case-management processes that support successful prosecution.
5. Geographic variation across SFPD stations
The decline in reported crime was not uniform across San Francisco; significant geographic variation exists between SFPD stations and neighborhoods. Some stations saw sharper decreases while others experienced smaller changes or localized increases, particularly in certain assault categories. That spatial heterogeneity requires station-level strategies, targeted community engagement, and data-driven deployment rather than one-size-fits-all citywide policies; it also matters for supervisors and district-level elected officials making budget and oversight decisions.
6. Alternative explanations and structural drivers
Experts cited broader structural and demographic shifts as important contributors to the decline rather than attributing the changes chiefly to specific policing initiatives. Demographic trends, migration patterns, and larger economic or social shifts can reduce crime propensity independently of policing tactics. For policy, this suggests investing in upstream interventions, housing stability, employment supports, youth programs, and tracking demographic indicators alongside crime data.
7. Comparative context with nearby cities and multi-year trends
The 2025 declines are placed in multi-year context and compared with nearby jurisdictions using data tables; these comparisons help determine whether San Francisco's drop is an outlier or part of a regional pattern. If surrounding cities show similar declines, regional factors may be driving the change; if not, city-specific policies or reporting differences may explain the divergence. Regional coordination on data sharing, prevention programs, and mutual aid should be considered based on those comparative findings.
8. Limits of reported-crime data versus arrests and prosecutions
A prominent caution in the data is that declines in reported incidents do not necessarily mirror arrest or prosecution trends. Changes in reporting behavior, charging practices, prosecutorial discretion, and court processing all affect how many incidents translate into arrests or convictions. For civic oversight and accountability, community members should track arrest and prosecution metrics separately and press for transparent dashboards from police, district attorney, and courts.
9. Implications for civic engagement and voting
Shifts in crime statistics influence voter priorities, ballot measure campaigns, and budget debates ahead of local elections. Residents and civic groups should bring these data to town halls, Police Commission hearings, and budget hearings to ask how declines are being sustained and whether investigative and prevention capacities are improving. Voting decisions and campaign platforms should reflect both recent trends and structural drivers, ensuring that policy responses are evidence-based rather than reactive to single-year swings.
10. Practical recommendations for officials and residents
To translate the 2025 data into durable public-safety improvements: • Expand investigative capacity where clearance rates remain low; • Target resources to stations and neighborhoods showing less decline or increases; • Invest in upstream social programs tied to demographic shifts; • Maintain transparent, timely public dashboards separating reported incidents from arrest and prosecution outcomes. Residents should demand clear metrics, attend oversight forums, and use comparative data to hold officials accountable for both short-term reductions and long-term safety strategies.
Know something we missed? Have a correction or additional information?
Submit a Tip

