Census Data Shows Immigration Slowdown Affecting Every U.S. Metro Area
In two-fifths of large U.S. metro areas, only immigration prevented population loss in 2024. Now a sharp slowdown threatens household growth for a decade.

Immigration rose sharply enough between 2020 and 2024 to flip the New York metropolitan area from the nation's biggest population loser to its biggest gainer, a reversal that illustrates just how structurally dependent U.S. metro growth has become on international migration. Now a steep drop in immigration is putting that gains in jeopardy across every metro area in the country, with large urban counties and border communities absorbing the sharpest early blows.
Immigration drove metro area population growth to be faster than national growth in 2024. Of the three drivers of population growth, including net domestic migration, net international migration, and natural growth of the resident population, immigration was the largest source in nearly two-thirds of metro areas, including almost every large metro area with at least one million residents, according to the Harvard Joint Center for Housing Studies, which used tabulations of the U.S. Census Bureau's Vintage 2024 Population Estimates Program.
In over a quarter of all metro areas, including two-fifths of large metro areas, there would have been population loss if not for immigration. In three-quarters of U.S. counties, population growth either slowed or turned negative, with large urban counties and the border registering the most severe effects.
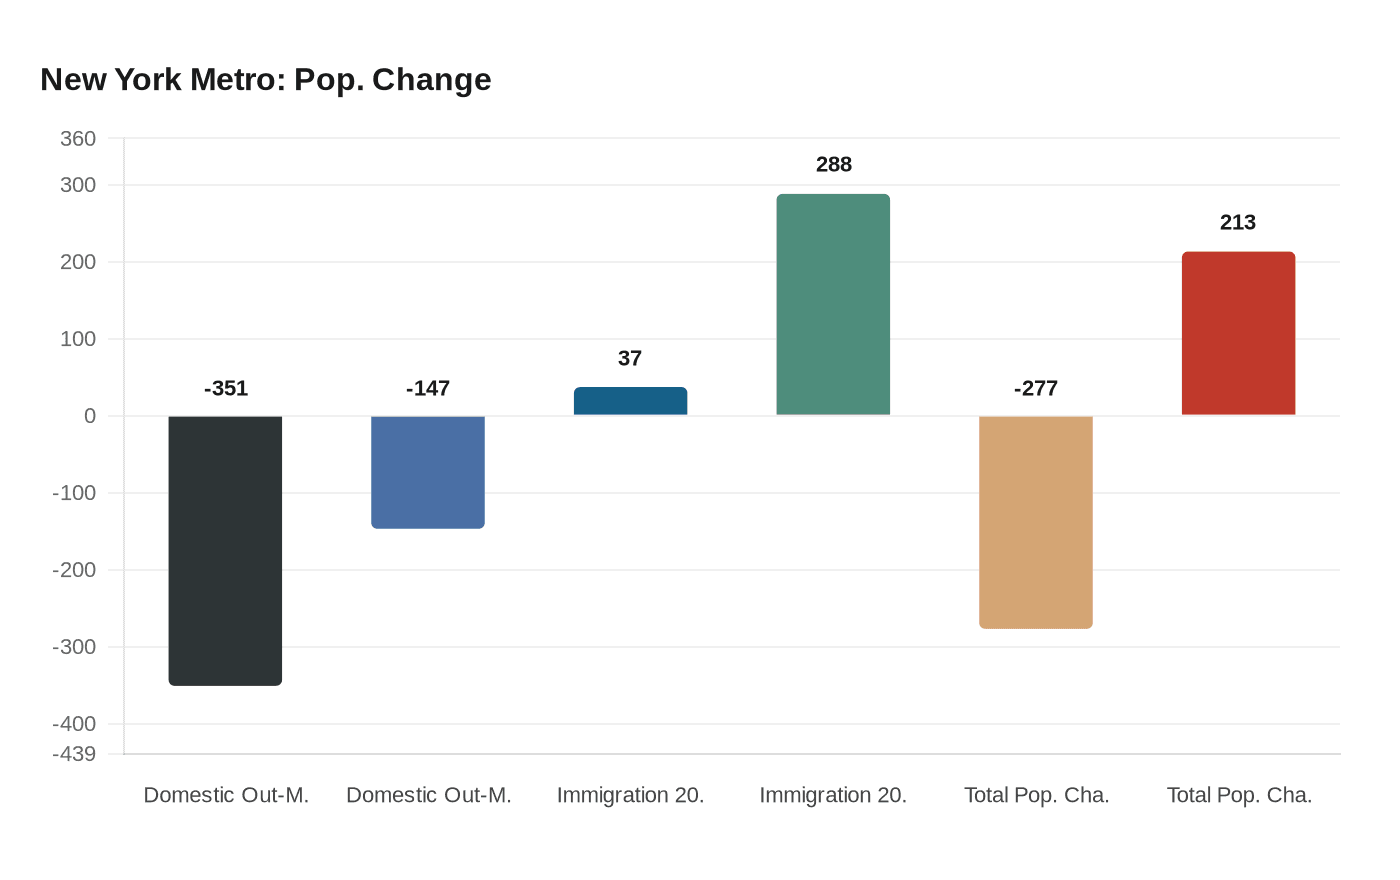
The Brookings Institution's analysis of the new census estimates puts specific numbers to the scale of the shift. New Census Bureau data show that the rise of immigration over the past few years, including both legal and undocumented immigrants, bolstered population growth across the nation and, in particular, large metro areas. The New York metro area offers the starkest illustration: domestic out-migration declined from a loss of 351,000 residents in 2020-21 to a loss of 147,000 in 2023-24, while immigration to New York surged from 37,000 to 288,000 over the same period. Those shifts, combined with a rise in natural increase, moved metropolitan New York from registering the biggest population decline of 277,000 in 2020-21 to the greatest gain of 213,000 in 2023-24. Brookings identified New York, Los Angeles, and Detroit as net domestic out-migration areas where higher immigration in 2023-24 directly improved population trajectories.

The broader regional picture compounds the urgency. The reduction in immigration will be felt unevenly due to regional differences in the drivers of population growth. Immigration played a large role in metro population growth in all regions in 2024 but was less central to metro areas in the South, which typically had both natural growth and net domestic inflows. Brookings found that the new census data also revealed a softening of peak pandemic-era domestic migration patterns, with smaller out-migration flows from coastal and Midwest metro areas and reduced in-migration to what it called "pandemic magnets" in the South and West. As domestic migration to several Sun Belt metro areas softened, immigration helped them maintain their growth levels.
The inflection point on the immigration trend itself is documented in the border data. The surge in immigration in 2022 through 2024 drove population growth nationally before immigration levels dropped precipitously. Border encounters have fallen from a monthly average of 240,000 during the surge to a monthly average of 37,000 in the first six months of 2025. This drop in border encounters implies a much lower level of immigration than in recent years.
The year 2024-25 saw a decline in immigration down to 1.3 million people, leading to much smaller population growth. Even so, because natural increase is so low, immigration still contributed to 71% of 2024-25 population growth. The Census Bureau projects that its estimated net immigration of 1.3 million people for the year ending June 2025 could be reduced to levels around 321,000 in the year ending June 2026.
The downstream consequences for housing markets could be severe. "The recent downturn in immigration will lead to slower growth or population loss in metro areas across the country in the short term, which will undercut household growth and housing demand in the long term." The Harvard Joint Center projects that if immigration levels remain below average amid the ongoing decline in natural change, there will be historically low household growth and demand for new housing units in the next decade. While this will affect all metro areas, large metro areas and those outside the Sunbelt will feel the effects most acutely given the recent centrality of immigration to their population growth.
Average metro area natural change is positive across regions, but this type of growth has been steadily declining and is projected to turn negative nationally by 2033. With domestic migration negative in every region except the South and natural growth eroding, the arithmetic of metropolitan America's demographic future increasingly runs through a single variable now in sharp decline.
This article was produced by Prism’s automated news system from verified source data, official records, and press releases, then run through automated quality and moderation checks before publishing. The system is built and supervised by the people who set the standards it runs under. Read our full AI policy.
Did this article answer your question?