EIA Updates U.S. Nuclear Generation and Capacity Data Through December 2025
The EIA updated nuclear generation and summer-capacity tables on Feb 24, 2026, reporting a 2025 nuclear add of 60.3 MW and a 2025 nuclear capacity factor of 91.0%.

The U.S. Energy Information Administration updated its Electric Power Monthly and Monthly Energy Review datasets on February 24, 2026, adding data through December 2025 and publishing state-level and reactor-level nuclear summer-capacity entries that revise the sector picture. The update records a 2025 net nuclear capacity gain of 60.3 MW and a 2025 nuclear capacity factor of 91.0%, and it makes reactor-by-reactor and state-by-state summer capacity available for analysis.
EIA tables cited in secondary commentary include ES1.A and ES1.B for total industry statistics, 1.1.A for net renewable generation, 6.1 for electric generating summer capacity changes, 6.1.A for estimated net summer utility and small-scale solar capacity, and 6.07.A and 6.07.B for capacity factors. EIA presents its capacity data as "summer capacity" defined as "the maximum output that generating equipment can supply to system load at the time of summer peak demand." Hydropower in these products excludes pumped storage, and small-scale distributed solar is estimated and reported separately.
On nuclear specifics, the updated datasets feed two contrasting snapshots. Southern Renewable Energy Association reports an installed nuclear fleet of 101,789 MW at the end of 2025, while EIA Short-Term Energy Outlook projections put nuclear at 98,451.5 MW at the end of 2026 if forecasts hold and note no new nuclear capacity is expected in 2026. Electrek and SolarQuarter highlighted that solar and wind combined generation surpassed nuclear output in 2025, a shift underscored by the modest 60.3 MW nuclear addition.
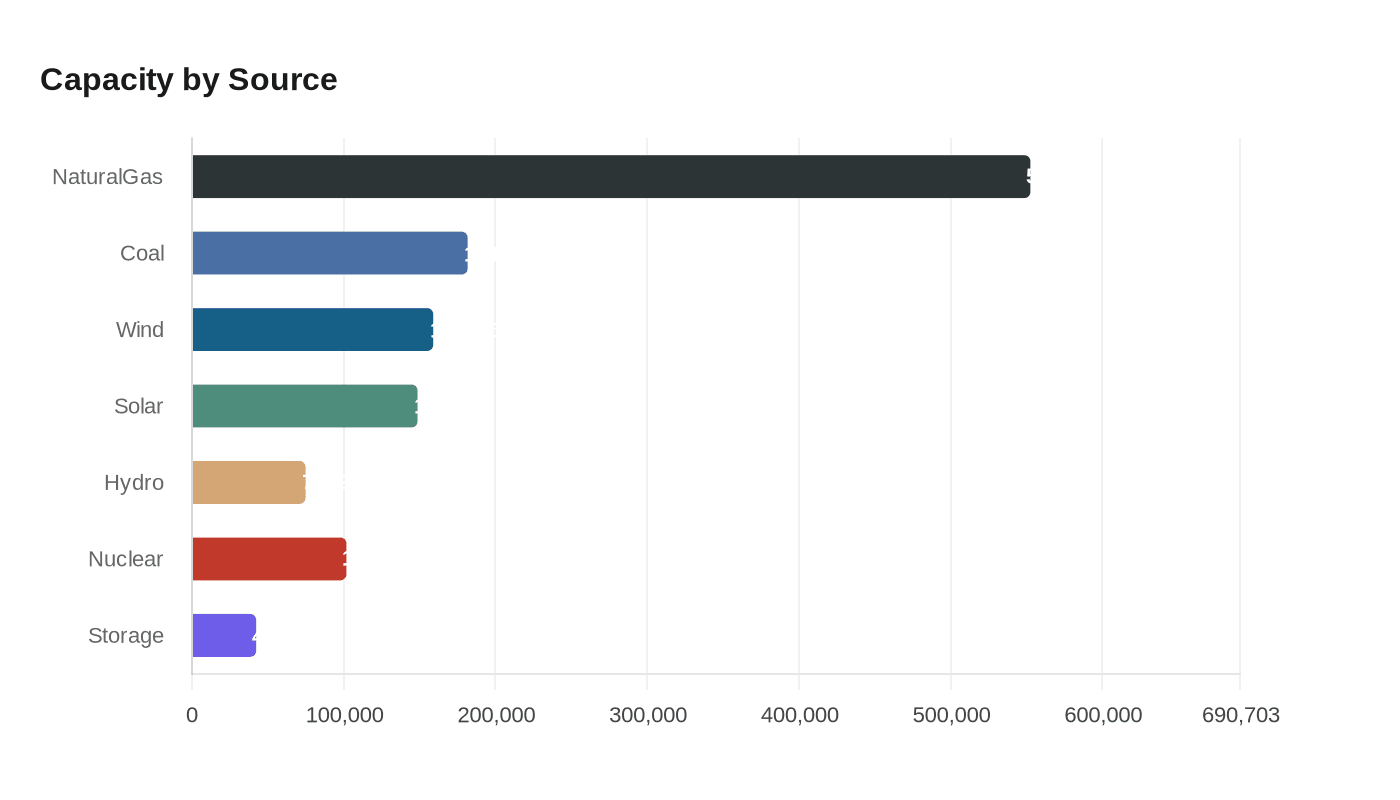
The sector-level totals compiled from SREA and EIA forms show a U.S. installed generation capacity of 1,323,499 MW. Resource breakdowns list natural gas 552,562 MW, coal 181,690 MW, wind 158,963 MW, solar 148,667 MW, hydro 74,799 MW, nuclear 101,789 MW, and battery storage 42,336 MW. SREA also cataloged planned additions totaling 261,631 MW, led by solar 119,888 MW, battery storage 65,746 MW, gas 44,683 MW, and wind 27,318 MW.

Year 2025 net changes were dominated by renewables and storage - renewables plus battery plus small-scale solar grew by 55,808.8 MW, while fossil fuels and nuclear together grew by 772.7 MW. Resource-specific moves for 2025 include natural gas +5,731.5 MW, coal −4,397.4 MW, petroleum −559.4 MW, other fossil −62.2 MW, and small-scale solar additions of 6,277.4 MW. SUN DAY Campaign projects at least 6,000 MW of small-scale solar again in 2026.
EIA forecasts in the STEO envision 80,809.2 MW of utility-scale renewable and battery additions in 2026 and an estimated 6,000 MW or more of small-scale solar, producing projected end-of-2026 capacities of renewables including small-scale 525,356.1 MW and natural gas 514,212.5 MW. Those projections underpin headline claims such as "EIA: 62% more renewable energy capacity is coming in 2026."
Generation shares show renewables produced 25.7% of U.S. electricity in 2025, up from 24.1% in 2024; wind generated 10.3% and rose 2.8 percentage points year over year, with December wind generation 19% higher than a year earlier. Wind and solar together supplied nearly one-fifth of U.S. electricity in 2025, exceeding coal by 15.7% and nuclear by 8.7%, while natural gas output fell 3.3% year over year.
Capacity-factor detail from EIA tables shows coal 48.7%, natural gas 58.4%, nuclear 91.0%, utility-scale wind 34.2%, and utility-scale PV 24.4%, with small-scale PV noted as typically 10 to 25%. As Ken Bossong of the SUN DAY Campaign put it, "Dramatic growth by solar, wind, and battery storage is the key take-away of EIA’s 2025 data," and "And if EIA’s projections for 2026 prove correct, (to paraphrase Al Jolson) you ain’t seen nothing yet." SREA frames its work with industry advocacy in mind: "SREA advocates for policies that support renewable energy deployment and protect the industry from legislative threats. Our efforts ensure that renewable energy companies influence regional energy policies, focusing on growth, tax incentives, siting, and decommissioning requirements."
Differences in metrics reflect methodology choices - renewables account for 33.2% of utility-scale capacity excluding storage and 36.3% including estimated small-scale solar - and the EIA update clarifies the underlying summer-capacity and capacity-factor cells that produce those shares. If EIA forecasts hold, renewables will overtake natural gas in capacity by the end of 2026 while nuclear capacity remains essentially flat compared with 2025.
Know something we missed? Have a correction or additional information?
Submit a Tip

_82415.jpg&w=1920&q=75)