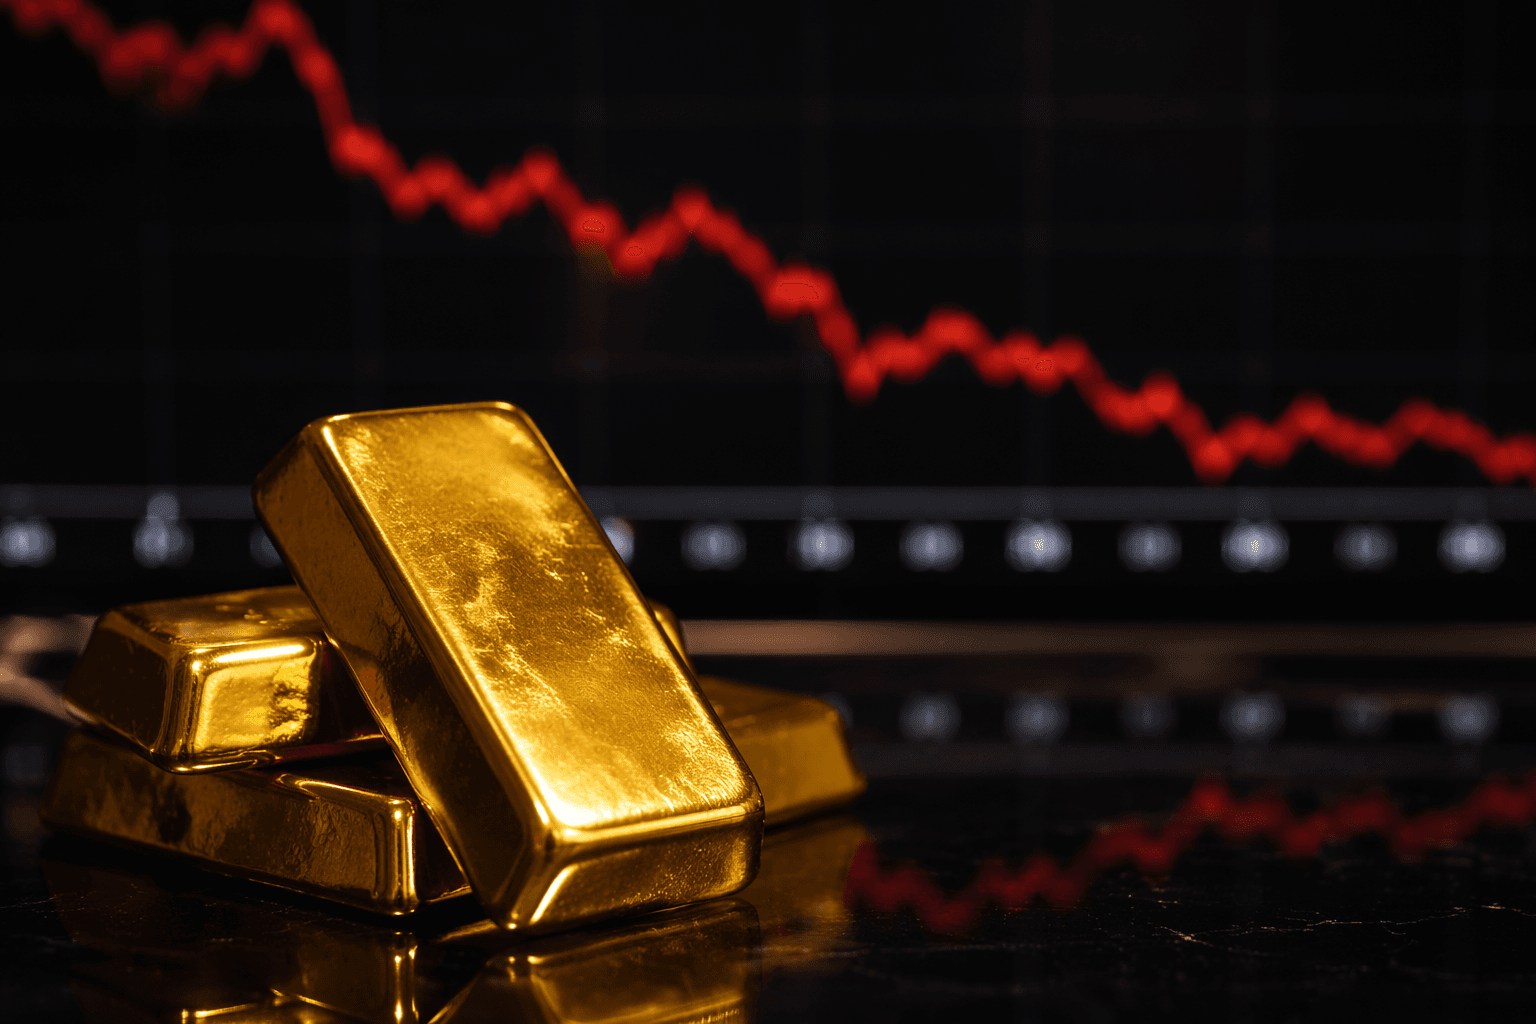
Gold tests key 200-day average as bearish trend deepens
Gold hovered near its 200-day average after a January blow-off top, leaving investors to judge whether a 38% yearly gain can survive the selloff.

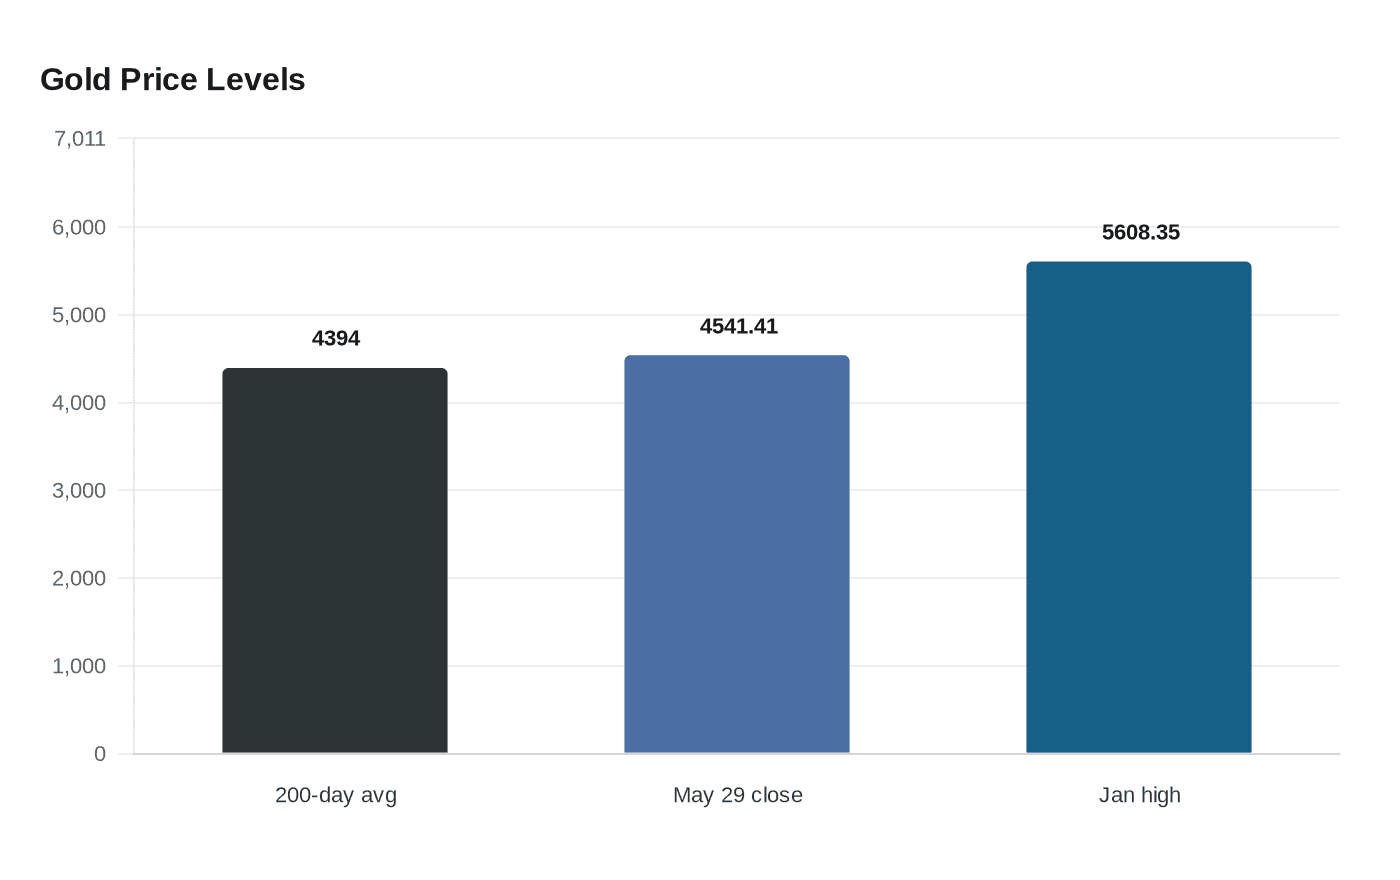
Gold’s latest slide has brought it to a level traders watch almost by instinct: the 200-day moving average, a line near $4,394 that often separates a healthy uptrend from a deeper reversal. After a sharp run early in 2026 and a sudden selloff on January 30, the metal has been printing progressively lower highs, a pattern technical analysts often read as a bearish trend losing momentum rather than a clean reset.
Even after the pullback, gold still closed May 29 at $4,541.41 an ounce, according to Trading Economics. That left the metal down 1.76% over the previous month, but still 38.07% higher than a year earlier. The contrast matters: gold also hit an all-time high of $5,608.35 in January, so the current debate is not whether the rally was real, but whether the market is digesting a massive advance or starting a more lasting retracement.
A decisive move away from this crossroads will likely come down to the same forces that drove gold higher in the first place. Softer interest-rate expectations and a weaker dollar would make it easier for gold to hold a bid, especially if investors start looking for protection against policy mistakes or slower growth. If rates stay firm and the dollar strengthens, the metal could lose one of its most important supports. Geopolitical risk also remains a core driver: when tensions rise, gold tends to regain its safe-haven premium quickly.
The fundamental backdrop is still mixed. The World Gold Council said geopolitical factors are expected to remain front and center in gold demand in 2026 and beyond, supporting continued central-bank net buying, broader ETF inflows and bar-and-coin accumulation. In Q1 2026, global central banks added 244 tonnes to reserves, bar-and-coin demand rose 42% year over year to 474 tonnes, and the value of total demand reached a record $193 billion.
But investor sentiment has turned less steady. The council said physically backed gold ETFs saw record outflows of US$12 billion in March 2026, which cut Q1 inflows to US$12 billion. That kind of whipsaw shows how quickly momentum can shift when prices are stretched. If gold can hold above the 200-day average, bargain hunters may treat the correction as a pause inside a larger bull market. If it breaks below, traders are likely to see confirmation that January’s surge was a blow-off top and that the market is entering a more extended reset.
This article was produced by Prism’s automated news system from verified source data, official records, and press releases, then run through automated quality and moderation checks before publishing. The system is built and supervised by the people who set the standards it runs under. Read our full AI policy.
Did this article answer your question?