Satellite data reveals cities grow in sudden bursts, not smoothly
Satellite imagery showed six global cities growing in bursts, with one neighborhood’s boom often revealing little about what was happening across town.
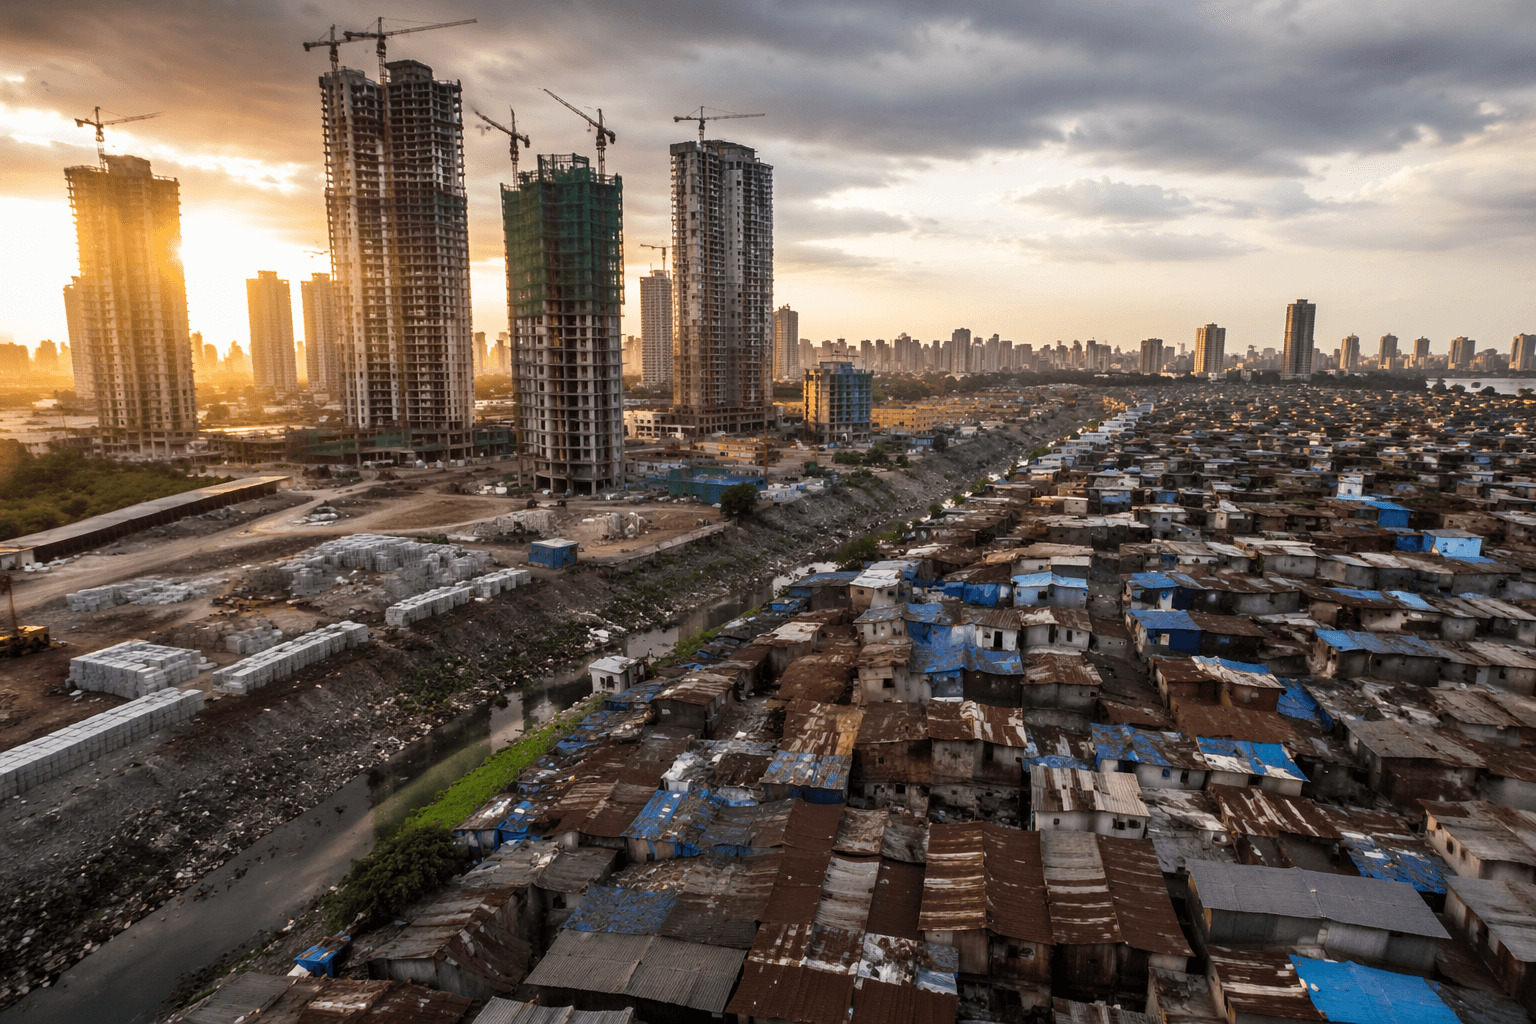
A new satellite-based measure of urban growth suggests cities do not expand in a smooth line. Instead, they pulse, with construction surging, pausing and restarting in different neighborhoods at different times, a pattern that could change how governments judge when roads, housing and utilities are falling behind.
Researchers tracked Dubai, Lagos, Mexico City, Mumbai, Seattle and Shenzhen using dense time-series images from NASA’s Harmonized Landsat and Sentinel-2 satellites. The study, published June 8, 2026 in Proceedings of the National Academy of Sciences, built a metric called Capital Infrastructure and Real Assets, or CIRA, and paired it with a deep-learning and time-series method called CAPES, developed by former University of Connecticut postdoctoral researcher Ji Won Suh.
The finding cuts against the way cities are often measured now: through annual statistics, census-style snapshots and footprint maps that flatten timing into averages. Zhe Zhu of the University of Connecticut said the approach works more like monitoring a human pulse, because it can show a city’s health in motion rather than as a still image. Karen C. Seto of the Yale School of the Environment said the central lesson is that urbanization is spiky, not steady, and that static maps have long hidden the unevenness of growth.
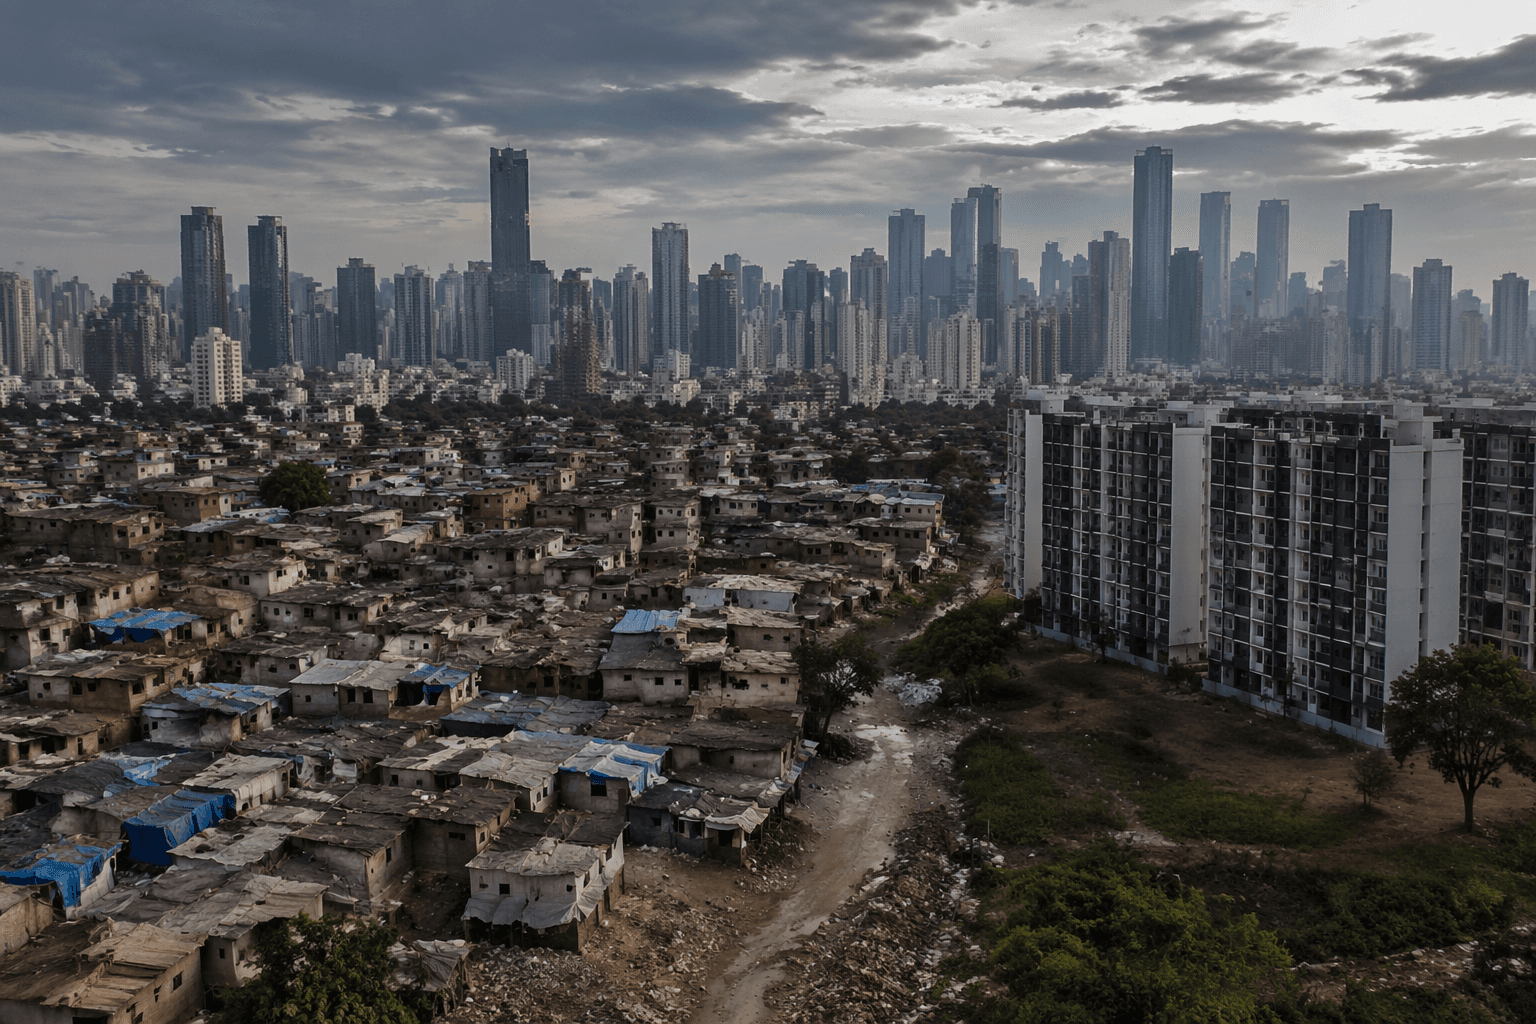
That matters because the study found that neighborhoods inside the same city often developed out of sync. A construction boom in one district said little about activity elsewhere, which means a fast-building edge of Shenzhen or Dubai may not reflect conditions across the broader metropolitan area. In Dubai, the team visualized rapid expansion using monthly construction data from the city’s 65 most active locations, showing how distinct neighborhoods moved through abrupt, cyclical and asynchronous bursts.
The researchers also used the framework to examine the effect of COVID-19 on the six cities and found divergent recovery paths, with some places changing development rhythms in lasting ways. That result gives planners a sharper warning system for economic stress or stagnation, one that could flag trouble before it shows up in annual accounts or broad land-use maps.
For governments trying to assign transit dollars, approve housing, harden infrastructure and prepare for disasters, the difference is more than technical. If urban growth arrives in bursts rather than a smooth climb, then resource allocation based on yearly averages can miss the moment when a neighborhood’s streets, drains, schools and power lines are already under strain.
This article was produced by Prism’s automated news system from verified source data, official records, and press releases, then run through automated quality and moderation checks before publishing. The system is built and supervised by the people who set the standards it runs under. Read our full AI policy.
Did this article answer your question?


