FCS budget rankings reveal spending gap shaping competitive balance
Montana State's $13.38 million football budget shows how far FCS spending has stretched. The gap now touches depth, travel, staffing, and playoff staying power.

Money that buys margin
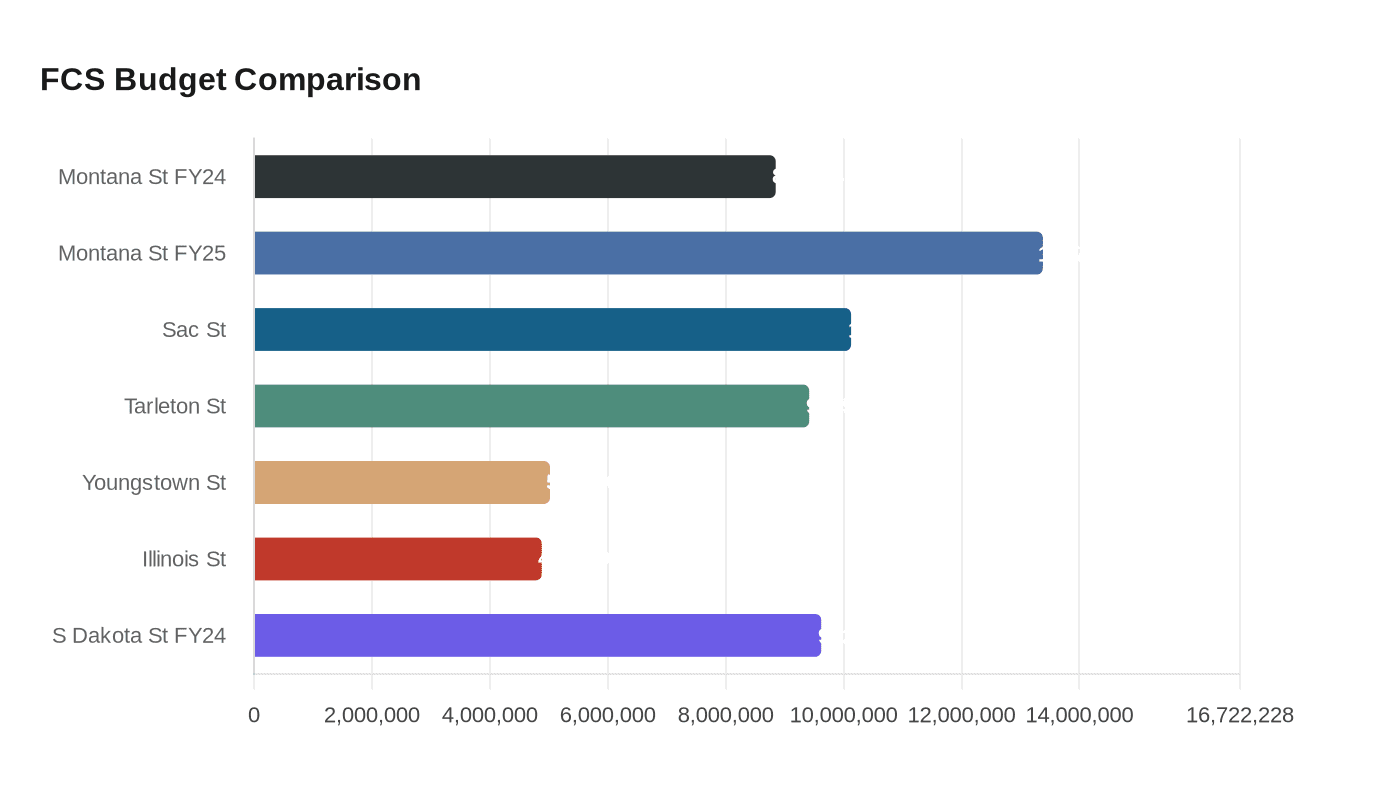
Montana State’s $13,377,782 football budget is the number that resets the conversation in FCS football. It is not just the biggest spending figure in the subdivision for FY25, it is a reminder that money still buys practical advantages in the places that decide seasons: depth, staff size, travel, nutrition, equipment, and the ability to keep pressure on opponents deep into November and December.

The gap is not abstract. Montana State added $4,530,140 in one year, rising from $8,847,642 in FY24 to $13,377,782 in FY25. That kind of jump changes what a program can carry from the offseason into game week, and it is why budget reporting has become one of the cleanest ways to explain why some FCS teams can sustain championship-level runs while others spend most of the fall trying to stay whole.
What the dollars actually buy
Football operating budgets are more than a line on an athletic department ledger. They typically cover scholarships, coaching staff salaries, travel expenses, equipment, and stadium or facility debt, which means the size of the budget affects the quality of almost every football decision a program makes. A larger budget can mean more support staff, better recovery resources, and fewer compromises when it comes to road trips, logistics, and retention.
That matters because FCS football is often decided by the hidden edges. A team with a deeper support structure can absorb injuries better, keep players fresher, and create a more stable offseason environment. A program that is forced to stretch every dollar has to be sharper, more efficient, and more creative just to keep pace with schools that can fund the basics at a higher level.
Montana State changed the map
The Montana State figure lands at the top of the FY25 FCS spending picture, but it becomes even more striking when set beside the rest of the subdivision. Sacramento State checked in at $10,126,064, Tarleton State at $9,415,847, Youngstown State at about $5.02 million, and Illinois State at about $4.88 million. That spread tells the real story: FCS is competitive on Saturdays, but its financial tiers are not especially close.
South Dakota State is an important reference point in that picture. The Jackrabbits led the FCS in FY24 at $9,620,366, which shows how recent the top-end spending surge has been and how quickly the financial ceiling can move. Montana State’s leap above that benchmark suggests a program that is not merely keeping up, but trying to build a sustained operational advantage.
Why the gap shows up on the field
The budget divide affects more than the football office. It shapes whether a team can build the kind of two-deep roster needed to survive injuries, whether it can keep quality assistants together, and whether it can handle the wear that comes with long trips and a full championship chase. In FCS, where margins are already thin, financial strength often shows up as steadiness, not flash.
That is why a program with a bigger operating budget can feel sturdier in November. It may be better equipped to retain staff, maintain facilities, and avoid the kind of operational shortcuts that eventually show up in performance. Lower-spend programs can still win, but they often have to do it by being more efficient than the ledger says they ought to be.
The outlier status matters beyond FCS
Montana State’s budget does not only matter inside its own subdivision. HERO Sports noted that the Bobcats’ FY25 football budget surpassed the operating budgets of 20-plus FBS teams, including Northern Illinois, Wyoming, and UTEP. That is the kind of comparison that changes how people think about resource gaps, because it shows that the FCS top tier is no longer simply a smaller version of the same economic ladder.
It also underlines a central reality of modern college football: spending power does not map neatly onto subdivision labels. Some FCS programs now operate with more financial muscle than a significant chunk of the FBS, while others remain far below the top end of their own league. The result is a subdivision that remains competitive, but not evenly resourced.
Realignment raises the stakes
The spending story lands in a year when the FCS landscape is already shifting. Sacramento State and North Dakota State are moving to the FBS in 2026, and NCAA realignment coverage has pointed to a broader reshuffling across multiple FCS conferences. Sacramento State’s football-only entry into the MAC for 2026 has already been reported, and those moves only sharpen the question of which programs are built to survive the next round of change.
That is why budget data matters now. Schools with larger football operations are better positioned to handle the cost of transition, the pressure of retention, and the constant escalation that comes with chasing higher-level competition. For programs staying behind, the challenge is not just replacing departing rivals, but doing so in an environment where the most resource-rich teams can separate faster than ever.
How the numbers are built
The FY25 figures come from school financial reporting tied to NCAA data, specifically MFRS reports filed to the NCAA and obtained through open-records requests by Extra Points. That methodology matters because it provides one of the few standardized looks at college football spending across Division I, even if the picture is still incomplete. Private schools, and some public schools, are not required to disclose football budget information through FOIA or open-records requests, which means the public only sees part of the full financial map.
The NCAA says financial data is reported annually by Division I and Division II schools to give a clear view of revenues and expenses across athletics departments. The Knight Commission, through the Knight-Newhouse College Athletics Database and related resources, is part of the broader push for transparency and accountability in college sports finance. Put together, those tools do not just explain who spent the most. They show how college football’s competitive balance is increasingly tied to what a school can afford to sustain.
The real FCS takeaway
The smartest way to read the FY25 budget picture is not as a simple ranking, but as a measure of competitive oxygen. Montana State’s surge to $13.38 million, Sacramento State’s $10.13 million, and Tarleton State’s $9.42 million show how far the top of the subdivision can travel financially in a single year. Below that, schools like Youngstown State and Illinois State are still trying to win in a different economic class.
That is the reality check the numbers deliver: in FCS football, budgets do not guarantee championships, but they shape the odds behind every roster decision, every road trip, and every late-season push. The teams that can spend more are buying margin, and in this subdivision, margin is often the difference between a good year and a playoff run that lasts.
This article was produced by Prism’s automated news system from verified source data, official records, and press releases, then run through automated quality and moderation checks before publishing. The system is built and supervised by the people who set the standards it runs under. Read our full AI policy.
Did this article answer your question?