USDA data underscores persistent food insecurity, guiding A Simple Gesture planning
USDA's 13.7% food-insecurity rate is a planning signal, not just a headline. For A Simple Gesture, it argues for steadier routes, staffing, and pantry matches.
USDA’s numbers should change the schedule, not just the talking points
USDA says 13.7 percent of U.S. households, 18.3 million households, were food insecure in 2024, and 5.4 percent, 7.2 million households, experienced very low food security. The year-over-year change was not statistically significant, which is the operational story here: the pressure on food recovery is persistent, not episodic, and local planning has to assume a steady baseline of need.
USDA’s definition also helps sharpen how A Simple Gesture talks to donors, volunteers, and partner sites. Food-insecure households are uncertain of having, or unable to acquire, enough food because they do not have enough money or other resources, and households with low food security may cope by using federal food assistance or community pantries. That language matters because it moves the conversation away from generic appeals and toward the real work of keeping pickup routes, pantry shelves, and volunteer shifts reliable week after week.
Children and hidden household stress should shape where the work starts
The child-household numbers are the clearest reminder that need often sits below the surface. USDA says 18.4 percent of U.S. households with children were food insecure in 2024, and 9.1 percent, or 3.3 million households, had both children and adults who were food insecure sometime during the year. In about half of food-insecure households with children, only adults experienced food insecurity, which means a family can be under strain long before a child’s need becomes visible from the outside.
For A Simple Gesture, that should translate into a stronger focus on school-linked programs, pantry partners serving families, and volunteer messaging that understands household-level need rather than only visible hunger. It also explains why a route plan built around “obvious” demand is not enough. The need is often already there in families that are quietly stretching groceries, using assistance, and relying on nearby community support to get through the month.
Local data is what turns a national percentage into route design
Feeding America’s Map the Meal Gap gives local operators the part USDA cannot provide on its own, county- and congressional-district-level estimates of food insecurity and food costs across the country. Feeding America says the project has run annually since 2011, and its methodology uses publicly available U.S. Census Bureau and Bureau of Labor Statistics data, along with state-level relationships tied to poverty, unemployment, homeownership, disability prevalence, and related factors. That matters because it lets A Simple Gesture decide where to expand next based on measurable need instead of instinct alone.
The practical takeaway is straightforward: national USDA rates tell staff how large the problem is, while Map the Meal Gap helps decide where to place the trucks, which pantry relationships need more volume, and which neighborhoods should be prioritized for donor recruitment. Feeding America’s map site reports a 14.3 percent U.S. food insecurity rate in 2023, a reminder that the national picture remains elevated even when the yearly change looks small. For a nonprofit trying to build stable pickup lanes, “small change” at the national level does not mean low need on the ground.
What the numbers mean for A Simple Gesture’s operating model
A Simple Gesture-Guilford County says it was established as a 501(c)(3) in 2015, following the template created by Jonathan Trivers after the model began in 2011 in Paradise, California. The organization says the model has now been replicated by more than 70 chapters nationwide, which is useful context because it shows the program is built for repeatable logistics, not one-off charity events. In Greensboro, the start-up began in April 2015 with Westminster Presbyterian Church as the first sponsor, a local detail that still fits the same larger lesson: durable food recovery systems grow from dependable community infrastructure.
Its scale now makes the staffing question impossible to ignore. As of December 2025, A Simple Gesture says it had donated more than 8,000,000 child-size meals valued at $13,000,000, with 75+ pantry partners, 3,900+ recurring food donors, and 200 monthly volunteers. That is not a casual volunteer program; it is a logistics network that lives or dies on route density, backup coverage, donor retention, and the ability to keep people showing up after the first burst of enthusiasm fades.
Where to aim outreach, and why the food-recovery side matters
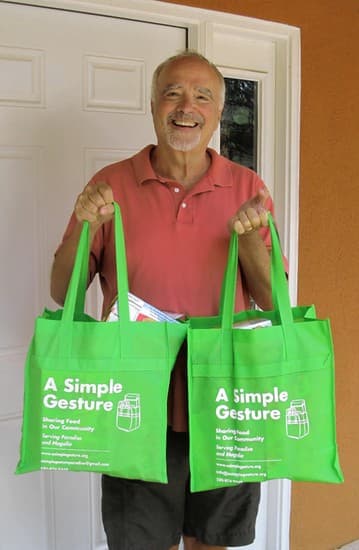
A Simple Gesture’s food-program mix gives staff a clear map for partner targeting. The group says it works through door-to-door green bag pickups, corporate pickups, timely food-recovery pickups, and the SHARE school program, where it partners with Guilford County Schools to place refrigerators that hold surplus food students can take during the day. It also says its food-recovery program rescues edible food from restaurants, event venues, grocery stores, and other businesses and gets it to local nonprofits instead of landfills.
That is where USDA’s child-household data becomes especially useful. If nearly one in five households with children is food insecure, and about half of those households are shielding children while adults absorb the strain, then schools and family-serving agencies deserve early attention. The best workplace targets are the places with predictable surplus, such as grocery stores, catered events, and food-service employers, because those are the pickup points where route planning can be scheduled instead of improvised.
The waste figure strengthens the pitch to businesses. A Simple Gesture says the U.S. wastes 30 to 40 percent of the food it produces, so food recovery is not just a hunger-response strategy, it is also a waste-reduction strategy that can be explained in operational terms to employers, venues, and stores. For local operators, that is the real data-to-action gap: national hunger statistics tell you the need is there, but the local route map, the pantry list, and the volunteer roster determine whether the food reaches the right doors on time.
The planning rule A Simple Gesture can carry forward
The strongest planning posture is to treat the USDA rate as a floor, not a headline. National food insecurity has stayed high, child-household stress remains widespread, and local estimates show the need can be narrowed down enough to shape routes, donor asks, and pantry coverage with far more precision than a broad anti-hunger message ever could. A Simple Gesture’s challenge is not proving that hunger exists. It is using the numbers to decide where the next bag, the next pickup, and the next volunteer hour will do the most work.
This article was produced by Prism’s automated news system from verified source data, official records, and press releases, then run through automated quality and moderation checks before publishing. The system is built and supervised by the people who set the standards it runs under. Read our full AI policy.
Did this article answer your question?