Goldman Sachs Warns Systematic Funds Could Sell $100B More in Equities
Goldman's models warn CTAs could dump $100B more in equities, with $36B hitting US markets, if the S&P 500 breaks below 6,707.

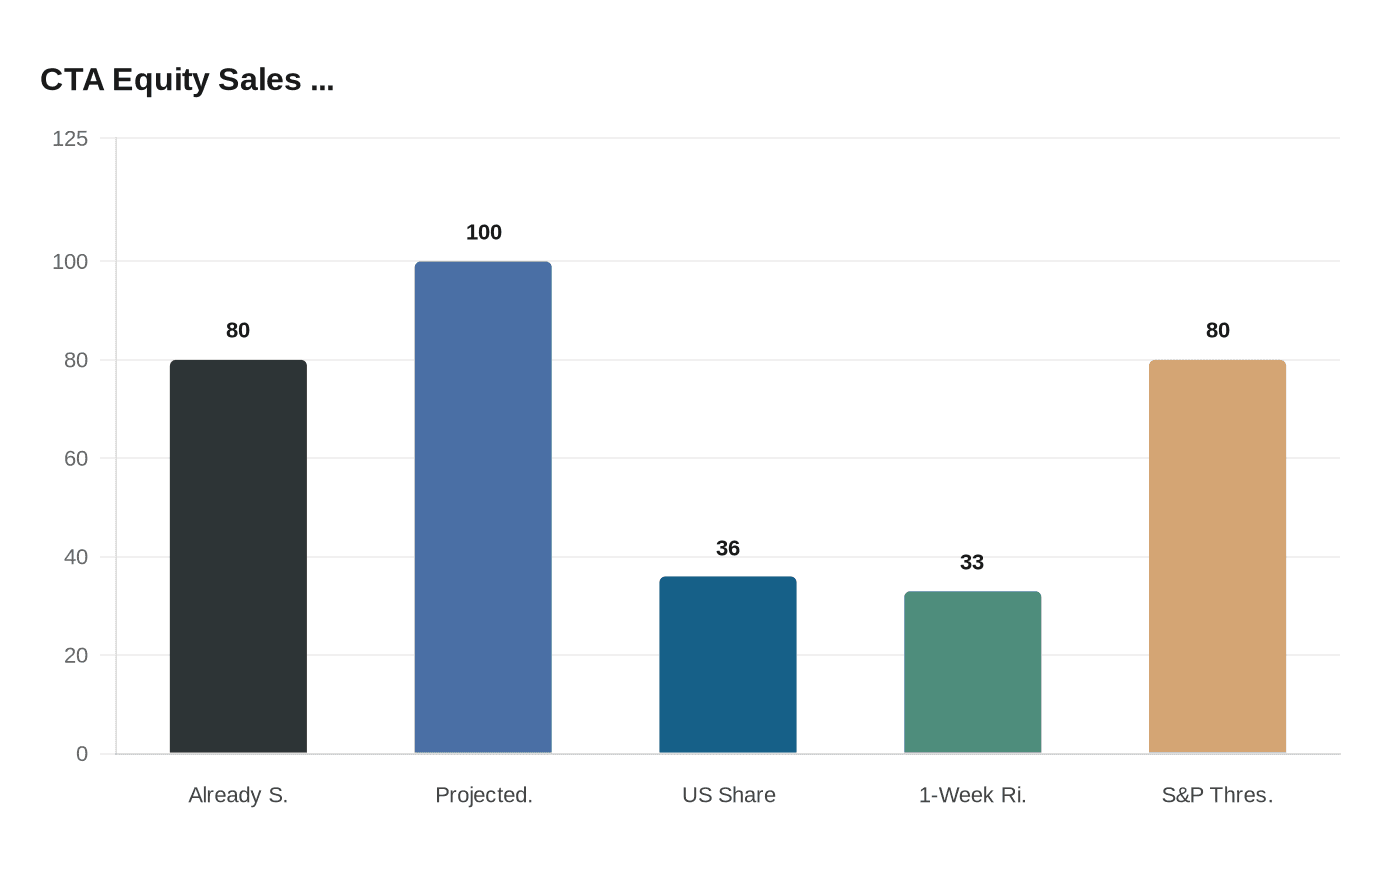
Trend-following systematic funds have already sold $80 billion in global equities, and Goldman Sachs is warning the selling isn't over. The bank's models project another $100 billion in potential equity sales ahead, driven by CTA momentum strategies responding to continued market pressure, with geopolitical stress from the Iran conflict cited as a key catalyst accelerating the trend-following signal.
US markets are expected to absorb the largest share of additional outflows, with Goldman estimating $36 billion in further sales concentrated domestically. The near-term risk is sharper still: Goldman projects CTAs could sell up to $33 billion in a single week if conditions continue to deteriorate.
The critical technical threshold is the S&P 500 at 6,707. Goldman's models indicate that a sustained break below that level could unlock up to $80 billion in additional systematic selling over the following month. The S&P has already breached a shorter-term trigger that prompts CTA selling, meaning the mechanism is already running, though Goldman's analysis notes that the path to the full $80 billion scenario is conditional, not automatic, and depends on whether selling pressure persists.

What makes these projections particularly concerning is the feedback loop they describe. Thin liquidity conditions and forced deleveraging can amplify CTA-driven selling into self-reinforcing cycles, where programmatic outflows push prices lower, triggering additional model-driven sales. Goldman's analysis flags that these dynamics could extend beyond equities, with Bitcoin and other risk assets vulnerable to spillover as their correlation with equities tightens during liquidity crunches.
The two $80 billion figures in Goldman's analysis are distinct: the first refers to what systematic funds already sold last month, while the second is a forward-looking projection tied specifically to the 6,707 S&P threshold. Goldman has not specified publicly whether those flows are additive or partially overlapping, and the $100 billion projection cited in the bank's data carries its own separate framing tied to Iran-related geopolitical pressure rather than exclusively to the S&P level trigger.
For anyone tracking market structure at Goldman or elsewhere, the 6,707 level is now the number that matters most in the near term.
Know something we missed? Have a correction or additional information?
Submit a Tip