KPMG: Household and Corporate Debt Rose Sharply in Q4 2025
Household net worth hit $181 trillion in Q4 2025, but Americans drained savings from 5.2% to 4% to keep spending as both household and corporate debt climbed ~3.3%.

Household net worth climbed to a record $181 trillion in the fourth quarter of 2025, driven by stock market gains — but the wealth headline obscures a more complicated picture of leverage building beneath the surface. The increase, worth $2.2 trillion, is providing the impetus for upper-income households to continue their consumption. That dynamic, according to KPMG Economics senior economist Ken Kim, carries real implications for how long the spending expansion holds.
The headline gain in net worth, however, masks key underlying movements. Financial assets, comprising stocks, mutual funds, and pensions, increased $2.6 trillion, while nonfinancial assets, mainly consisting of residential real estate, fell $354 billion. The stock market did the heavy lifting; the housing market pulled in the opposite direction. The positive wealth effect, Kim noted, is helping to drive consumption — but it is equity portfolios, not home equity, doing the work.
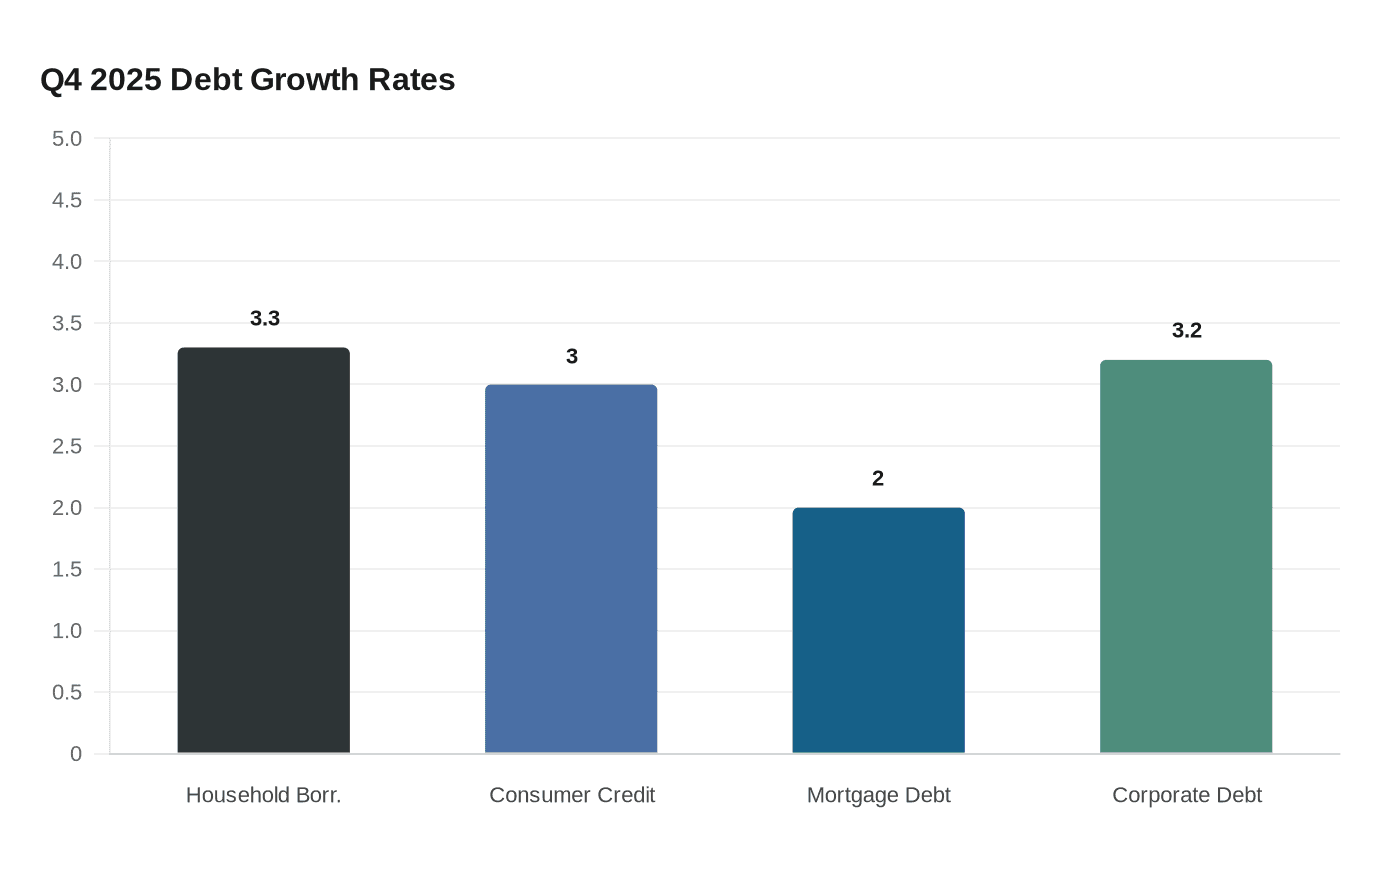
Households did not limit themselves to paper gains. Households took on more consumer debt and even tapped savings to continue spending. Consumer credit grew at nearly a 3% annual pace while mortgage debt rose 2%. Overall, household borrowing increased at a 3.3% annualized rate in the fourth quarter. The cost of that spending became visible in the savings data: the savings rate ended 2025 at 4%, down from 5.2% at the start of the year. For KPMG professionals tracking client balance sheets, that one-year drop is worth flagging; the buffer is thinner than it was twelve months ago.
Businesses moved in near-lockstep with consumers. Both business and household sector debt climbed at a similar pace in the fourth quarter, with nonfinancial corporate debt rising at a 3.2% annual rate. Loan growth was supported by easier conditions at banks for commercial and industrial loans for middle and larger enterprises, and expanding industrial output in 2025 helped, following two years of contraction. That revival in industrial activity gave banks the confidence to ease credit standards — a combination that fed corporate borrowing appetite through year-end.
The housing divergence tells a different story geographically. The Pacific and South Atlantic regions posted annual price declines, while the national nonfinancial asset figure turned negative. Kim's analysis points to structural forces reversing pandemic-era migration patterns: ongoing affordability issues and return-to-work mandates are undoing many of the housing moves made during the pandemic. For anyone at KPMG navigating a return-to-office requirement, that sentence lands differently — the policy decisions firms are making about in-office work are rippling into regional real estate markets in measurable ways.
The rate environment complicates the debt picture going forward. The balance of Fed projections moved toward fewer rate cuts, with Chair Jerome Powell noting "four or five people went from two to one" in their cut forecasts at the March 18 FOMC meeting, held the day before KPMG published its analysis. Seven members of the dot plot saw no 2026 rate cuts and seven saw one. With the forecast for personal consumption expenditures inflation climbing to 2.7% for 2026 and oil prices elevated by the conflict in the Middle East, the window for meaningful relief on borrowing costs is narrowing. Households and businesses piled on debt in Q4 at roughly the same pace; if rates stay higher for longer, the carrying cost of that leverage is the next variable to watch.
Know something we missed? Have a correction or additional information?
Submit a Tip