Monday.com urges engineers to measure productivity by outcomes, not output
Monday.com is telling engineers to stop counting tickets and start measuring shipped value. Its own dashboard shows how cycle time, stability, and recovery expose the real bottlenecks.
Why output is the wrong yardstick
Monday.com’s engineering productivity message starts with a blunt correction: more activity does not automatically mean more progress. Lines of code, closed tickets, and busy-looking dashboards can all rise while delivery slows, quality slips, or the business gets less value from the work.

The better question is whether teams are reliably producing the right results. That shift matters inside a company like monday.com, where engineering performance is tied not just to shipping software, but to how fast the platform can support growth, customer adoption, and new product bets.
The metrics that expose flow and quality
The guide argues for a small set of measures that reveal how work actually moves through a team. Cycle time shows how long it takes work to move from start to finish, deployment frequency shows how often code gets into production, and change failure rate shows how often those releases cause problems.
Recovery metrics matter just as much. DORA’s newer framing moves beyond the older MTTR language toward failed deployment recovery time, and the broader model now includes availability as part of a five-metric system. Team satisfaction rounds out the picture, because a team that ships fast but burns out is not operating sustainably.
- Cycle time shows where work slows down between planning, coding, review, and release.
- Deployment frequency reveals whether delivery is steady or stuck behind batch releases.
- Change failure rate shows whether speed is creating instability.
- Failed deployment recovery time shows how quickly teams can restore service after an issue.
- Team satisfaction helps leaders see whether the process is improving or grinding people down.
DORA’s argument is not that one metric tells the whole story. It is that these metrics, taken together, measure the outcomes of the software delivery process and predict stronger organizational performance and better team well-being. The point is to move away from vanity metrics and toward a system that shows whether the engineering organization is getting better.
That framework has real stakes. DORA’s 2019 Accelerate State of DevOps Report said the highest performers were twice as likely to meet or exceed organizational performance goals, and that the share of highest performers had nearly tripled to 20% of teams. In other words, this is not just a measurement debate, it is a competitiveness debate.
How monday.com is measuring this inside the product
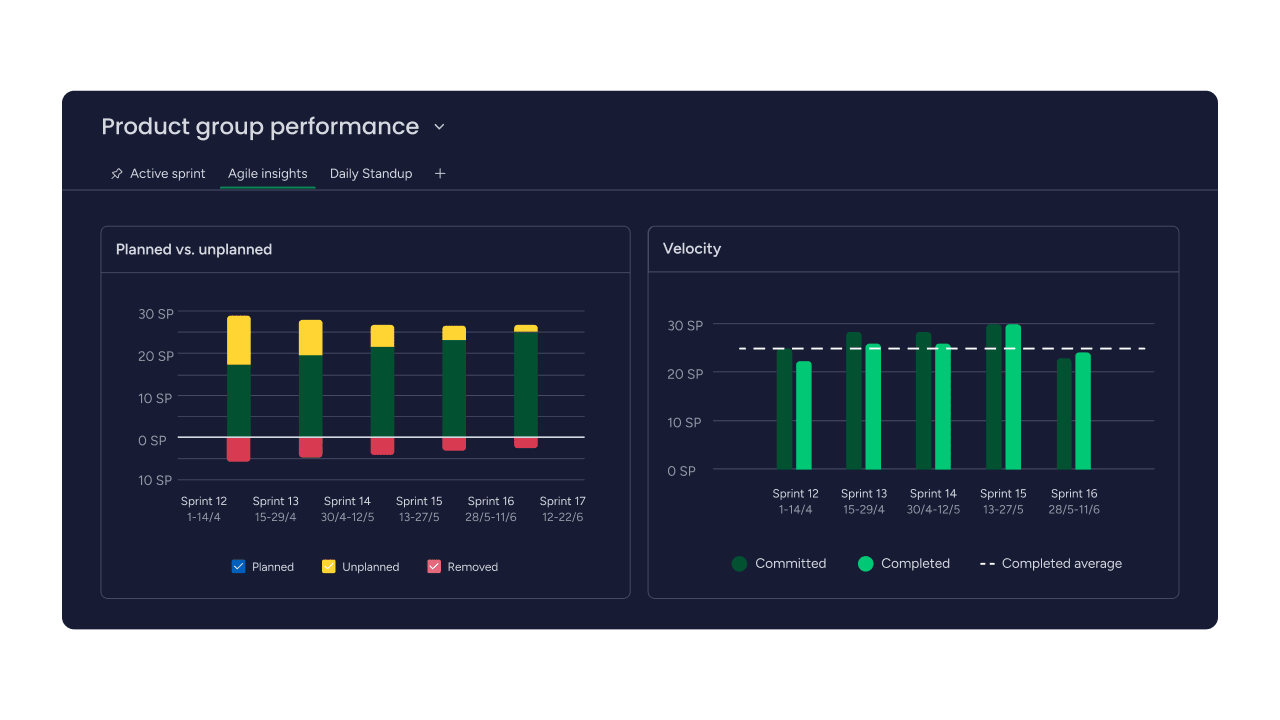
The most practical part of monday.com’s approach is that it is not treating measurement as abstract advice. Its Engineering Performance Dashboard in monday dev connects to GitHub and tracks sprint items alongside PR-stage metrics such as time to pull request, time to code review, time to approval, time to merge, and cycle time.
That matters because it turns productivity into something managers can inspect early, not after the quarter is over. A dashboard like that can show where a team is getting stuck, whether the slowdown is in review, approval, or merge steps, and whether the problem is process, staffing, or tool friction.
The company’s broader framing also makes the engineering story about more than velocity. monday.com says AI capabilities and platform engineering can improve productivity without sacrificing developer experience, which is the right test for teams that want automation without making work more brittle. The best systems do not simply make people move faster, they reduce handoff friction, surface bottlenecks earlier, and keep reliability visible.
That approach fits a company operating at scale. monday.com says it had more than 250,000 customers worldwide and 3,155 employees as of December 31, 2025, with 4,281 customers above $50,000 in annual recurring revenue. It also said fiscal 2025 revenue reached $1.232 billion, up 27% year over year, and that monday vibe became the fastest product in company history to surpass $1 million in ARR.
For engineers, that is the business case in plain sight. A product company growing that quickly cannot afford to confuse motion with progress, because every extra handoff, unstable release, or slow approval loop shows up somewhere downstream in customer experience and revenue.
The operating framework managers can actually use
The guide points to a repeatable way of managing performance, and it is simple enough to run without turning engineering into a spreadsheet exercise.
1. Define the goal first.
Decide whether the team is trying to improve speed, stability, reliability, or a combination of all three. If the goal is vague, the metrics will be too.
2. Choose a few metrics, not a wall of dashboards.
Cycle time, deployment frequency, change failure rate, recovery time, and team satisfaction are enough to show whether delivery is improving. More metrics can add noise instead of insight.
3. Centralize the data.
Pull it into one place so leaders can see trends instead of isolated numbers. The point is to understand the flow of work across the system, not to grade individuals by a single chart.
4. Review the data on a regular cadence.
Metrics only help if they are discussed consistently. When teams review them often, problems show up early enough to fix before they become expensive.
5. Iterate on the workflow.
If review time is too long, if merges are clogged, or if change failure rates are climbing, the process needs adjustment. Productivity improves when the system changes, not when people are simply told to work harder.
DORA’s 2024 research reinforces why this matters. Stable priorities are critical for well-being, and unstable organizational priorities reduce productivity while increasing burnout. The same research says internal developer platforms can improve individual productivity, team performance, and overall organizational performance, though they can also hurt stability and throughput if they are implemented carelessly.
That is the deeper lesson in monday.com’s guide. Productivity is not looking busy, and it is not squeezing more activity out of the same teams. It is building a repeatable operating system that ships useful software, keeps quality visible, and gives managers enough signal to remove friction before it becomes drag.
Why this matters beyond engineering
Engineering metrics are becoming a cross-functional language. Product managers can use them to see where roadmap commitments are slowing delivery, sales teams can use them to explain why platform investments matter to customers, and engineering leaders can use them to make the case for tools or process changes that improve flow without adding hidden debt.
For a company like monday.com, that shared language matters because growth now depends on execution as much as ambition. The firms that win on software are usually the ones that can see bottlenecks early, fix them quickly, and keep shipping without mistaking busyness for progress.
This article was produced by Prism’s automated news system from verified source data, official records, and press releases, then run through automated quality and moderation checks before publishing. The system is built and supervised by the people who set the standards it runs under. Read our full AI policy.
Did this article answer your question?