World records count by country reveals speedcubing’s global depth
A country-by-country record count shows speedcubing depth, not just stars. The June 28 refresh turns the sport’s global map into a live test of pipelines and coaching.

A country-by-country world-record count is one of the cleanest ways to see speedcubing differently. It does not just tell you who has the flashiest single result; it shows which national scenes keep producing elite solves across multiple events, and which ones still lean on one or two standouts. The June 28 refresh makes that picture especially sharp because it turns a familiar bragging-rights chart into a live read on depth.
Why the country chart matters
The basic idea is simple: more world records from one country usually means more than one gifted solver. It often points to a wider pipeline, where coaching, practice groups, hardware access, and competitive experience all feed into repeated breakthroughs. That is the real value of the chart for the speedcubing community. It helps separate a temporary spike from a durable system.
That distinction matters because a thin record count can hide how fragile a nation’s profile really is. A country with one superstar may look prominent in headlines, but a country with many records across events is usually the one building something sturdier. For federations and organizers, the chart becomes a benchmark for whether a local scene is simply active or genuinely deep.
The data is current enough to be useful
This is not a static historical table. The WCA records page was last updated on Monday, June 29, 2026 at 11:41 AM PDT, and the country-by-country records page was updated on June 28, 2026. The WCA also says results are usually updated after each competition weekend once results are finalized, which is why the records database can function as a near-live snapshot instead of a stale archive.
The current public export listed by the WCA is WCA_export_v2_172_20260621T000016Z, with a README dated June 22, 2026. That matters because the record count by country is only as meaningful as the database behind it, and here the underlying system is clearly being maintained in step with recent competition results. For anyone reading the chart closely, the point is not just who is ahead, but whether the underlying record pool is still moving.
What the map says about depth
The strongest takeaway from the country table is that speedcubing power is not evenly distributed, but it is also not frozen in place. Cubing has always had hotspots, yet the geography shifts as methods spread, hardware improves, and younger competitors learn faster than the last generation. The June 28 refresh captures that churn in a way a static leaderboard cannot.
A high record count usually signals breadth. It suggests a country is producing solvers who can push records in different events, not only one specialist carrying the whole national profile. That is where coaching culture and training environments start to show up in the numbers. In contrast, a lower total can reveal how much a country depends on a small number of stars to represent it internationally.
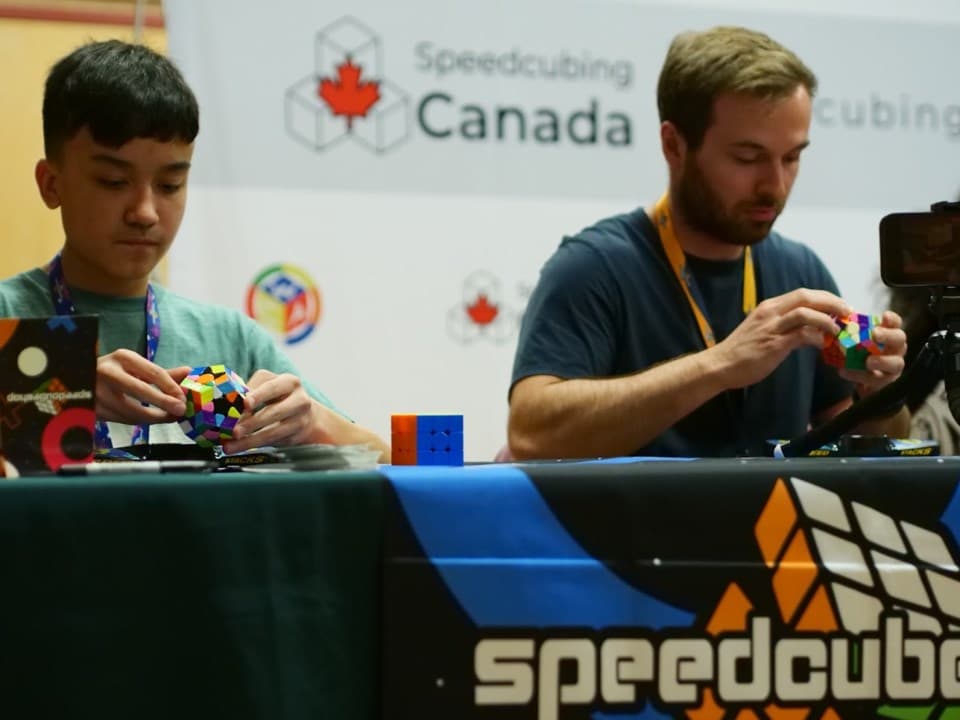
The WCA’s own country-band list adds another layer. It includes major cubing markets such as the United States, United Kingdom, Germany, Japan, China, India, Brazil, Canada, France, and Australia. That spread tells you the sport’s strongest record producers are not confined to one region or one type of national system. Competition access, community density, coaching, and talent development all appear to matter at once.
How the sport got here
The record count only makes sense against the long arc of cubing history. Ernő Rubik invented the Rubik’s Cube in the spring of 1974, and it became commercially available toward the end of 1977. The first World Rubik’s Cube Championship followed in 1982, giving the puzzle its earliest global competitive stage.
Then came the rebuild. The Yahoo! Speedsolving Rubik’s Cube Group launched in June 2000, and Ron van Bruchem launched speedcubing.com in July 2000. Those online communities helped carry the sport through its revival, and the World Cube Association was formed in August 2004 with the first regulations that turned cubing into the standardized international competition scene it is now. The country record chart is really a product of that history: invention, dormancy, internet revival, and formal governance.
The live system behind the numbers
The WCA governs official competitions for twisty puzzles, including the Rubik’s Cube, and its infrastructure is built to keep pace with real meets. WCA Live is the platform for running competitions and sharing live results, which gives the sport a public rhythm that earlier generations never had. When records fall, the result can move from a weekend competition into the wider ecosystem quickly.
That live system is why country totals are worth reading as more than trivia. The WCA recognizes a total of 199 countries and regions, so any record count is being measured against a genuinely wide competitive map. In that context, the chart becomes a way to ask a serious question: where is the sport producing repeated excellence, and where is a single name still doing most of the heavy lifting?
What to look for when you read it
The most useful way to use the chart is to look for patterns, not just tallies.
- A high total across several events points to a deep training culture.
- A small total built around one or two names can mean a nation has a star, but not yet a broad pipeline.
- A rising total after a new export refresh can signal that a local scene is maturing faster than its old reputation suggests.
- A country that appears often in the records list and also sits within the WCA’s recognized competition map is usually one with steady access to official events.
That is the real story behind the June 28 refresh. The chart does not just crown countries; it shows which ones keep turning puzzle solving into repeatable competitive strength. In a sport where the surface can look like a lone fingertrick and a stopwatch, the country-by-country record count exposes the infrastructure underneath.
This article was produced by Prism’s automated news system from verified source data, official records, and press releases, then run through automated quality and moderation checks before publishing. The system is built and supervised by the people who set the standards it runs under. Read our full AI policy.
Did this article answer your question?