Low-income households spend far more of income on transportation
Gas is a small national line item for many drivers, but the lowest-income households paid 30.6% of pretax income for transportation in 2024.
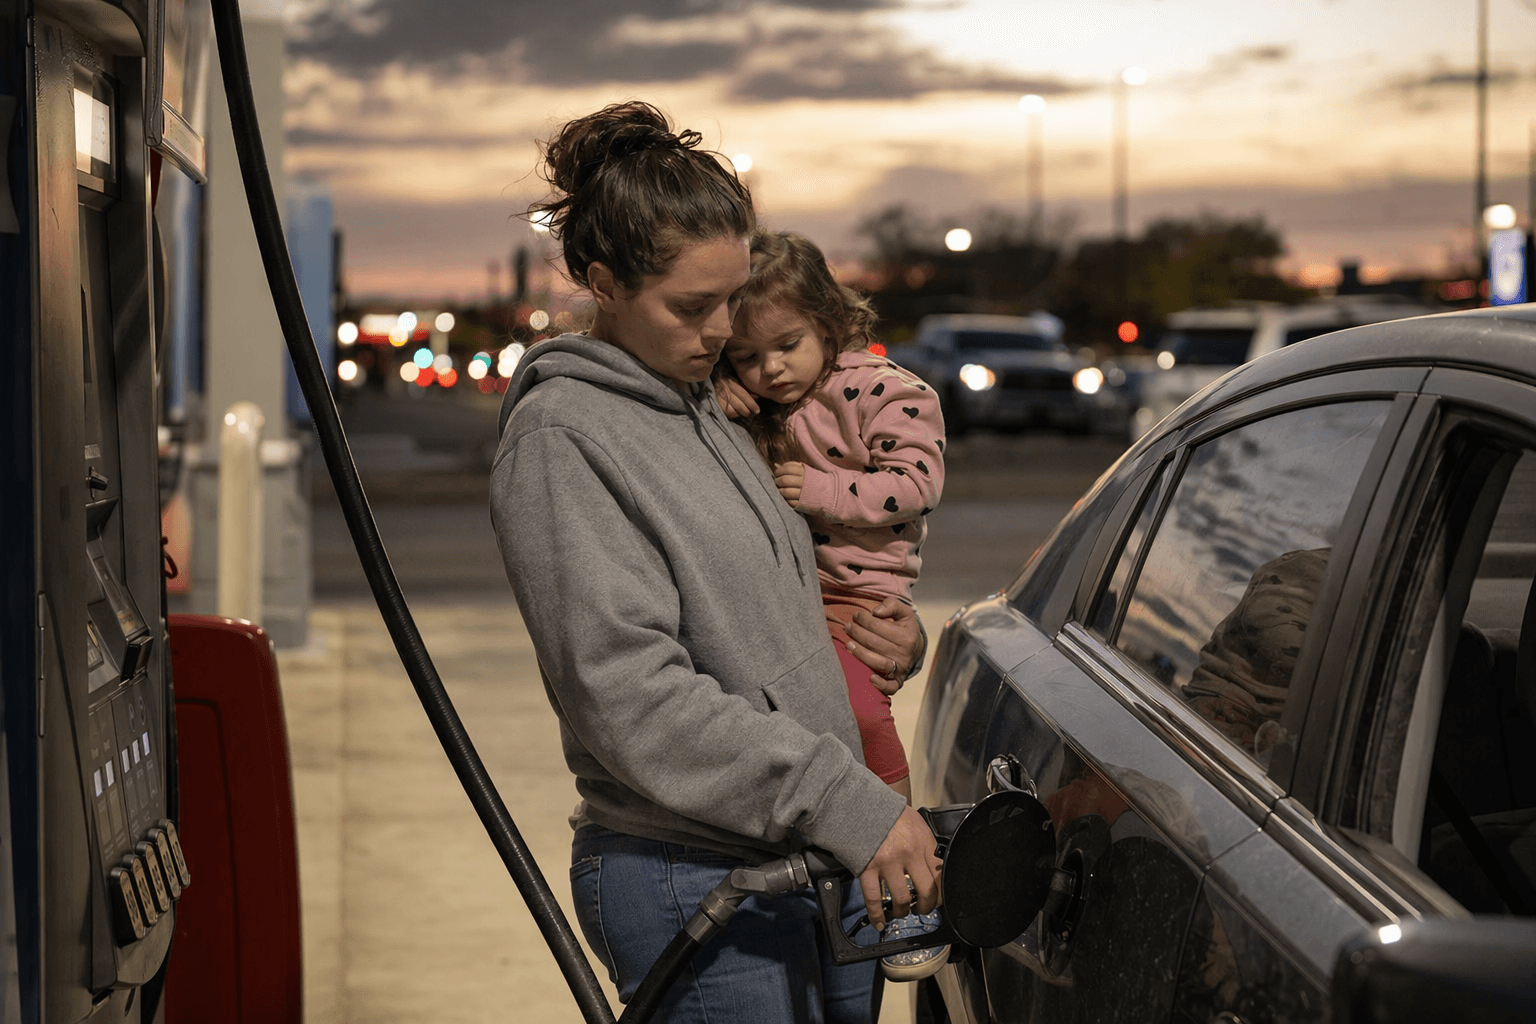
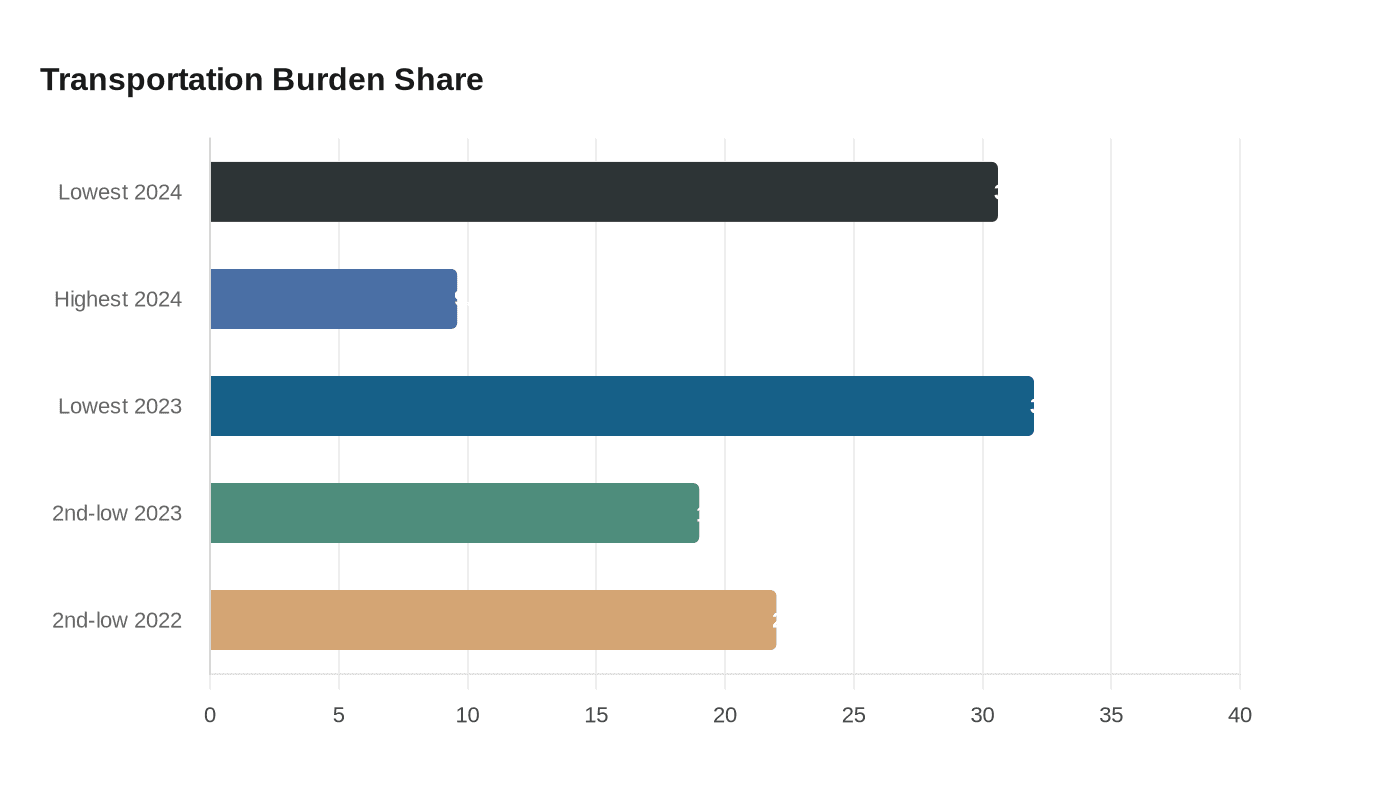
Transportation is swallowing a far larger share of the budgets of low-income Americans than of affluent households, turning gasoline and car ownership into a regressive drain rather than a routine expense. In 2024, households in the lowest income quintile spent an average of $5,105 on transportation, while households in the highest quintile spent $25,378. But the sharper divide is measured as a share of income: transportation took 30.6% of pretax income for the lowest-income quintile, compared with 9.6% for the highest.
That gap shows why national averages can hide the pain. The U.S. Energy Information Administration said Sept. 9, 2025, that U.S. drivers were expected to spend less than 2% of personal disposable income on gasoline in 2025, the lowest share since 2005 except for 2020. For higher-income households with multiple vehicles and more room in the budget, that may be manageable. For families on the lower end of the income scale, every increase at the pump competes with rent, groceries and other essentials.
The burden is not just a matter of prices. Transportation was the second-largest household expense behind housing in 2022, accounting for 15% of average household spending. In 2023, households in the lowest income group spent $4,917 on transportation and 32% of pretax income on it. The second-lowest income group saw some relief, with the transportation burden falling to 19% from 22% in 2022, but the pattern remained clear: lower incomes paid far more, as a share of income, to keep moving.
That imbalance reflects how many vehicles and how many people are in each household. In 2023, households in the lowest income quintile averaged 1.6 people and 1.0 vehicle, compared with 3.2 people and 2.6 vehicles in the highest quintile. Higher-income families spend more in total dollars because they have more cars and more drivers, but the lower-income households are the ones most exposed when fuel climbs and driving is not optional.
The strain is especially acute where transit gaps leave no good substitute for a car. Urban Institute has noted that housing and transportation are the two largest expenses for most families and often take up 50% or more of overall spending. Its 2025-2026 affordability data showed Americans still struggling to afford essentials and expecting little improvement, a backdrop that makes fuel inflation harder to absorb. Brookings estimated on April 27, 2026, that a $1-per-gallon gas increase would cost a typical median-earning, two-driver household about $70 a month, or roughly 1% of post-tax income. For families already balancing high rent and thin margins, that kind of increase is not a nuisance. It is another forced tradeoff in a budget that has no slack.
This article was produced by Prism’s automated news system from verified source data, official records, and press releases, then run through automated quality and moderation checks before publishing. The system is built and supervised by the people who set the standards it runs under. Read our full AI policy.
Did this article answer your question?

%3Amax_bytes(150000)%3Astrip_icc()%2FCertificate-of-deposit-2301f2164ceb4e91b100cb92aa6f868a.jpg&w=1920&q=75)
