U.S. jobs report looks stronger than underlying labor market data
The April jobs report beat expectations, but household data show a thinning labor force, falling participation, and a narrower base of hiring.
A split-screen labor market
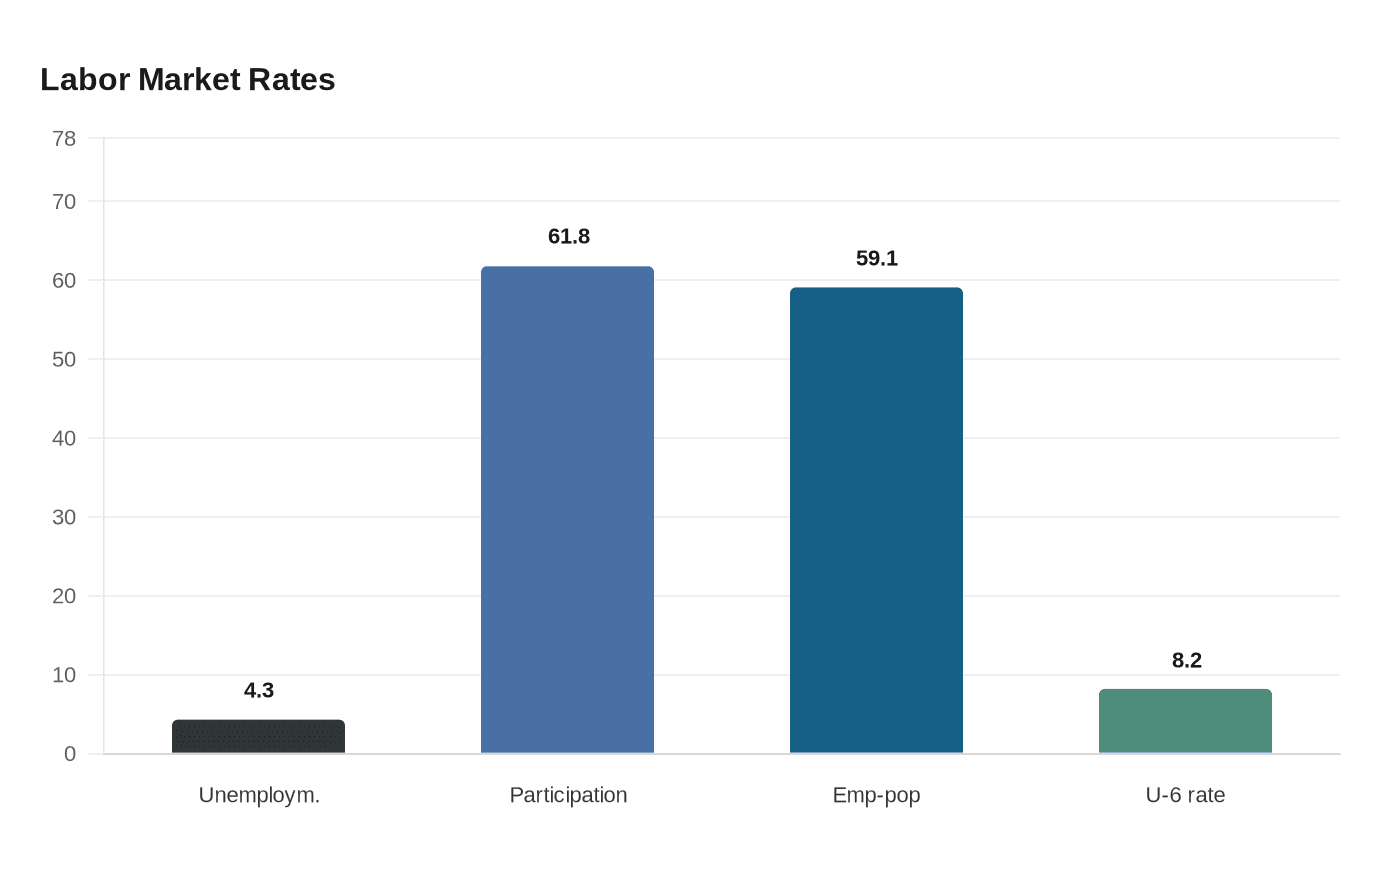
The latest jobs report looks sturdy at first glance: payrolls rose by 115,000 in April and the unemployment rate held at 4.3 percent. But the deeper read is less comforting. The headline gain rests on a labor market where participation is fading, the workforce is shrinking, and the household survey is telling a much weaker story than the employer survey.
That divide matters because it changes how the report should be interpreted. A payroll beat can suggest resilience, yet a shrinking labor force can keep unemployment from rising even when the underlying demand for workers softens. For households, that can mean fewer opportunities and slower wage gains. For the Federal Reserve, it means the labor market may look healthier than it really is.
Why the headline looks better than the underlying data
The U.S. Bureau of Labor Statistics said nonfarm payroll employment edged up by 115,000 in April, and it revised March gains up to 185,000 from 177,000. February was revised down to a loss of 65,000 jobs, which trims some of the strength from the earlier picture. Even so, April’s number still marked a second straight month of job growth above expectations.
The gains were also concentrated in a limited set of industries. Health care, transportation and warehousing, and retail trade accounted for the month’s job additions, while federal government employment continued to decline. That kind of concentration is important: when job growth is spread across a wider range of industries, it usually signals a more durable expansion. When it is clustered in a few sectors, the labor market can appear stronger than it really is.
Two surveys, two stories
Part of the confusion comes from the fact that the Employment Situation report is built from two separate surveys. The establishment survey measures nonfarm employment, hours, and earnings by industry. The household survey measures labor force status, including unemployment, by demographic characteristics. In April, those two surveys pointed in different directions.
The employer survey showed payrolls at a record 158.7 million and up 304,000 so far in 2026. The household survey, by contrast, showed overall employment down 1.37 million this year. That gap is not just a statistical quirk. It suggests that the job market is not expanding evenly across the population, and it raises the possibility that some of the apparent strength in payroll data is being offset by fewer people counted as employed in the household series.
The labor force itself is also contracting. BLS said the civilian labor force fell by 92,000 in April, while household employment dropped by 226,000. The labor force has now fallen in four of the past five months. Since last November, about 1.55 million people have left the labor force, a pace exceeded only by the pandemic-era exodus of 2020.
Participation is doing the quiet weakening
The clearest warning sign is participation. The labor-force participation rate was 61.8 percent in April, unchanged from the prior month but the lowest since October 2021 outside the pandemic period. The employment-population ratio stood at 59.1 percent. Those figures matter because they show that the labor market is not simply adding workers at a slower pace. It is also failing to draw enough people in from the sidelines.
That thinning labor force helps explain why the unemployment rate has not jumped even as other indicators soften. If fewer people are in the labor force, fewer are counted as unemployed. In other words, a flat unemployment rate does not necessarily mean a healthy labor market. It can also reflect fewer people looking for work, which is a weaker foundation for household income and spending.
The broadest unemployment measure reinforces that caution. The U-6 rate was 8.2 percent in April, a reminder that underemployment and marginal attachment remain elevated relative to the headline rate. Long-term unemployment was also still high at 1.8 million people, accounting for 25.3 percent of all unemployed workers. That is a sign that joblessness is becoming harder to shake for a meaningful slice of the labor force.
What this means for households and the Fed
For households, the split between payroll strength and participation weakness has practical consequences. A labor market can look firm on paper while still leaving more people outside the job engine entirely. If the labor force keeps shrinking, workers have less bargaining power, and job gains may be harder to access for people trying to re-enter after a layoff, caregiving break, or period of discouragement.
For the Federal Reserve, the report complicates the read on labor conditions. A 4.3 percent unemployment rate and steady payroll growth can be viewed as signs of resilience, especially during a period of inflation pressure and geopolitical uncertainty. But the underlying data point to a workforce that is thinning out, which makes the apparent boom less secure than it first appears. That is a different message for policymakers than a simple payroll beat.
The risk is that the Fed may see a labor market that looks stable enough to tolerate tighter policy, while households experience something less robust: fewer available workers, narrower hiring, and weaker participation. In that environment, headline payroll growth can mask a slower deterioration that only becomes obvious later, once the labor force has already pulled back.
The bottom line
April’s jobs report was not weak, but it was less solid than the top line suggested. Job growth beat expectations for a second month, yet the underlying data showed falling participation, a shrinking labor force, and a narrow set of industries carrying the gains. That combination is why the report reads less like a broad-based boom and more like a labor market holding up on the surface while losing depth underneath.
This article was produced by Prism’s automated news system from verified source data, official records, and press releases, then run through automated quality and moderation checks before publishing. The system is built and supervised by the people who set the standards it runs under. Read our full AI policy.
Did this article answer your question?