EIA update tracks U.S. biofuels capacity and feedstock shifts
EIA's monthly biofuels update shows where U.S. capacity sits and which feedstocks are moving, before those shifts show up in margins.
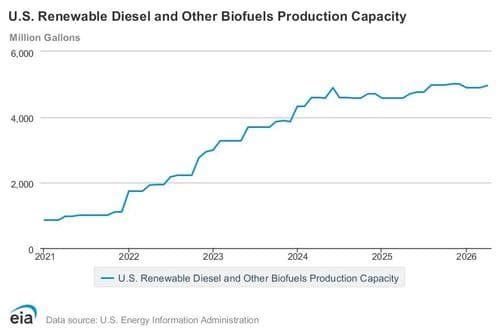
The EIA’s January 2025 capacity table put U.S. operable biofuels capacity at 24,990 million gallons per year across biodiesel, fuel ethanol and renewable diesel and other biofuels. The agency’s monthly update pairs that plant snapshot with feedstock tables that show what is being consumed at the mill, from corn grain and grain sorghum to residues and dedicated energy crops. The series is a practical read on feedstock substitution, utilization changes and outages before those moves show up in renewable diesel and biodiesel margins.
What the update tracks
EIA’s Monthly Biofuels Capacity and Feedstocks Update is built around two core tables. Table 1 tracks operable production capacity for biodiesel, fuel ethanol, and renewable diesel and other biofuels, with all capacity measured in million gallons per year. Table 2 tracks monthly feedstocks consumed for the production of biofuels, including corn grain, grain sorghum, agriculture and forestry residues, dedicated energy crops and other feedstocks.
The agency’s biofuels reporting framework is broader than a single fuel slate. EIA includes fuel ethanol, biodiesel, renewable diesel, renewable heating oil and renewable jet fuel in the series, which gives the update a wider view of how the U.S. biofuels system is changing at the plant level.
The feedstock side is where the market can change fastest. U.S. biofuel production increasingly depends on soybean oil, used cooking oil, tallow, distillers corn oil, canola oil and other lipid inputs. Those feedstocks do not move the same way on price, availability or carbon intensity, so a monthly table can show when producers are leaning into cheaper or more abundant inputs and when substitution is flowing from one stream to another.
The January 2025 capacity picture
EIA’s January 2025 table showed 18,426 million gallons per year of operable fuel ethanol capacity, 1,984 million gallons per year of biodiesel capacity, and 4,580 million gallons per year of renewable diesel and other biofuels capacity.
Biofuels production capacity growth slowed in 2024. The January 2025 capacity figures show that the sector still has substantial installed base, but the pace of additions is no longer moving at the same clip as the buildout phase that followed the first wave of renewable diesel investment.
Why feedstocks move first
The feedstock tables are especially valuable for renewable diesel and biodiesel because margins can turn quickly when the spread between feedstock cost and product value changes. A plant may have operable capacity on paper, but actual output still depends on feedstock availability, product pricing and logistics. If a producer shifts from soybean oil toward used cooking oil or tallow, that move can show up in the monthly feedstock mix before it becomes obvious in wider market commentary.
The same table also keeps corn-linked biofuel inputs in view. EIA’s Table 2 includes large volumes of corn grain, with smaller quantities of grain sorghum, agriculture and forestry residues, dedicated energy crops and other feedstocks.
For crushers, renderers, recyclers and traders, the monthly feedstock read is a signal on where competition is tightening. More demand for lipid feedstocks can reprice soybean oil, used cooking oil and tallow at different speeds, while the smaller cellulosic and residue lines in the table help show whether broader feedstock diversification is actually taking hold.
Policy still sets the frame
The Renewable Fuel Standard, created by the Energy Policy Act of 2005, remains the main federal backdrop for the sector. California’s Low Carbon Fuel Standard adds another layer, because carbon intensity and feedstock sourcing feed directly into project economics, especially for renewable diesel and other low-CI fuels. The EIA update does not replace those policies, but it shows how plants and feedstock choices respond inside that framework.
EIA announced the Monthly Biofuels Capacity and Feedstocks Update in March 2021, and the first release was on March 31, 2021. Since then, the series has provided a recurring public benchmark for operating capacity, feedstock shifts and utilization patterns on the ground.
University of Illinois farmdoc daily work has shown that renewable diesel growth has reshaped oil and fat markets, increasing competition for lipid feedstocks and shifting trade flows. USDA’s Foreign Agricultural Service found that U.S. renewable diesel production growth has had a global impact on feedstock trade.
How to use the series now
The capacity table and the feedstock table are most useful when read together. Capacity tells you how much installed production the market can support, while feedstocks show what is actually flowing into that production system in a given month. When those two tables move in the same direction, the signal is stronger; when capacity is steady but feedstocks shift, it often points to margin pressure, feedstock substitution or a logistics bottleneck.
This article was produced by Prism’s automated news system from verified source data, official records, and press releases, then run through automated quality and moderation checks before publishing. The system is built and supervised by the people who set the standards it runs under. Read our full AI policy.
Did this article answer your question?