A Simple Gesture uses USDA data to target hunger hotspots
USDA map data can help A Simple Gesture place routes, partners, and outreach where access barriers are strongest, not just where donations are easiest.

Census-tract maps in the USDA Food Access Research Atlas give A Simple Gesture a way to turn broad hunger concerns into block-by-block decisions. Instead of treating every neighborhood the same, the chapter can use census-tract data to see where vehicle access, distance to supermarkets, and low-income conditions overlap with the places its volunteers already reach.
Why the Atlas matters for a doorstep donation model
The Atlas is a spatial overview of food access indicators by census tract, which makes it useful for a program built around home pickups, pantry drop-offs, and business recovery routes. It flags low-income and low-access tracts using multiple measures, including urban thresholds of one-half mile and one mile from a supermarket, plus rural thresholds of 10 miles and 20 miles. It also includes a vehicle-access measure for tracts where more than 100 households have no vehicle and live more than one-half mile from a supermarket, or where a significant number or share of residents live more than 20 miles away.
A route that looks efficient on paper can still miss the places where getting to a store, pantry, or donation site is hardest. The Atlas can help staff ask whether their service area matches real access barriers, whether some neighborhoods need stronger volunteer coverage, and whether pantry partners sit close enough to donor clusters to keep collections practical.
The tool also includes an indicator for high shares of people in group quarters, which adds another layer for chapters that work near campuses, shelters, residential facilities, or other institutional settings. Users can search by address, so a coordinator can test a specific street, business corridor, or pantry location instead of making decisions from a citywide view alone.
What the data can and cannot do
The Atlas will not assign a green-bag route or tell a chapter exactly where to place every pickup. It is a planning lens, not a dispatch system. But it can help leaders compare how maps change when distance thresholds shift, when vehicle access is included, or when they want to see whether a proposed outreach area actually fits the county’s food-access pattern.
If one pocket of Guilford County has a cluster of low-income, low-access tracts, that can guide where to recruit volunteers, where to spend outreach dollars, and which community partners should hear first about service changes. It also gives staff a clearer way to explain why some neighborhoods receive more attention than others without relying on guesswork.
The current version of the Atlas is built from 2019 supermarket lists, the 2010 Decennial Census, and the 2014-18 American Community Survey. The underlying tract polygons are based on 2010 census tract boundaries, which matters when staff compare current service plans with older maps or past route designs. ERS first published comparable low-income and low-access measures in 2013, so the Atlas also gives A Simple Gesture a historical baseline for seeing how food access mapping has evolved over time.
How A Simple Gesture’s model fits the map
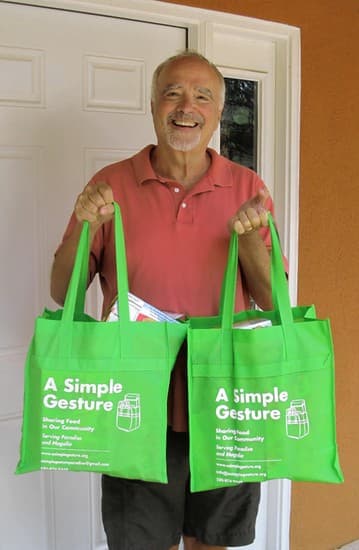
Its Guilford County chapter has made donations easy since 2015 through door-to-door pickups, corporate pickups, and food-recovery pickups. That model depends on volunteers who can move food out of homes and businesses quickly, then connect it to the pantry network before it spoils. Its mission is to provide a sustainable supply of food to local food pantries in Guilford County, collect excess perishable food for local nonprofits and community meals, and support the SHARE program in Guilford County Schools.
The organization’s founder, Jonathan Trivers, started the model in Paradise, California, and the Guilford County nonprofit was established as a 501(c)(3) in 2015. In practice, the chapter is working across more than one lane at once: household donations, business recovery, pantry supply, and school support. That makes geography especially important, because each lane has different pickup windows, different donor behavior, and different delivery points.

Its food-recovery program matches businesses with more than 35 vetted nonprofits in Guilford County, while it partners with dozens of local food pantries across the county. A map like the USDA Atlas can help decide which businesses are close to the neighborhoods most likely to have access gaps, and which pantries are positioned to absorb donations without pushing drivers into long backtracks.
Volunteer planning is a workforce issue too
Route design is also a retention issue. Volunteer food rescuers must be 18 or older, able to lift 20-pound boxes, use a smartphone, and drive a clean personal car. Those requirements shape who can participate, but they also shape how hard each shift feels. If routes are too spread out, too dense, or poorly sequenced, the burden lands on the same reliable drivers and the chapter risks burning out the people it depends on most.
That is where tract-level data can support better recruiting. If a chapter knows certain neighborhoods have weak access and weak volunteer coverage, it can focus recruitment on nearby residents, corporate groups, or faith communities that reduce drive time and raise the chance that volunteers will stay. A more intentional route map can also help managers build shifts that fit a volunteer’s time and fuel budget, which matters when the work depends on personal cars.
Using geography to strengthen pantry partnerships
The Atlas can also help the chapter talk with pantry leaders in concrete terms. Instead of saying a neighborhood “seems underserved,” staff can point to census tracts that meet USDA’s low-access thresholds or vehicle-access criteria and then compare those to the pantry network. That makes partnership conversations more specific: where should a pantry host a drop site, where should a corporate pickup expand, and where is a gap large enough to justify a new community relationship?
That kind of planning is especially important for a nonprofit food-recovery group because donations move through a chain. A household gives a green bag, a volunteer collects it, A Simple Gesture sorts or routes it, and a pantry or nonprofit gets the food to residents. If one part of that chain is weak in a low-access tract, the whole system loses reach. The Atlas gives staff a way to see where that weakness is more likely to occur before the gap becomes obvious in missed pickups or thin pantry shelves.
The other tool in the field
A Simple Gesture also points residents to the Greater Guilford Food Finder app, an initiative of the Greater High Point Food Alliance and a free tool for locating emergency food resources across Guilford County.
The chapter’s December 2025 impact across Guilford County: more than 8,000,000 child-size meals donated, more than $13,000,000 in donated-food value, more than 75 pantry partners, more than 3,900 recurring food donors, and 200 monthly volunteers.
This article was produced by Prism’s automated news system from verified source data, official records, and press releases, then run through automated quality and moderation checks before publishing. The system is built and supervised by the people who set the standards it runs under. Read our full AI policy.
Did this article answer your question?