St. Louis pantry map helps identify hunger gaps across neighborhoods
A pantry-desert map is turning hunger response into route planning, showing where access breaks down and where food recovery teams should expand next.
In Overland, Missouri, the hard part is not proving that hunger exists. It is figuring out which neighborhoods are still being missed when a pantry is open only a few hours a week and demand keeps climbing. That is why the new St. Louis pantry-desert map matters: it turns a broad need into an operations problem, forcing hunger-relief teams to decide where to send volunteers, where to add pickup routes, and where outreach has to start before the next crisis hits.
Why the map changes the job
Ritenour Co-Care Food Pantry executive director Angela Gabel said the old tools could show where pantries sit on a map, but not whether they are taking new clients, when they are open, or what kind of food they provide. That gap is not academic. A pantry that serves hundreds of families several times a week operates very differently from one that is little more than a box of canned goods, and a one-mile service radius can look generous on paper while still missing families who cannot get there during limited hours.
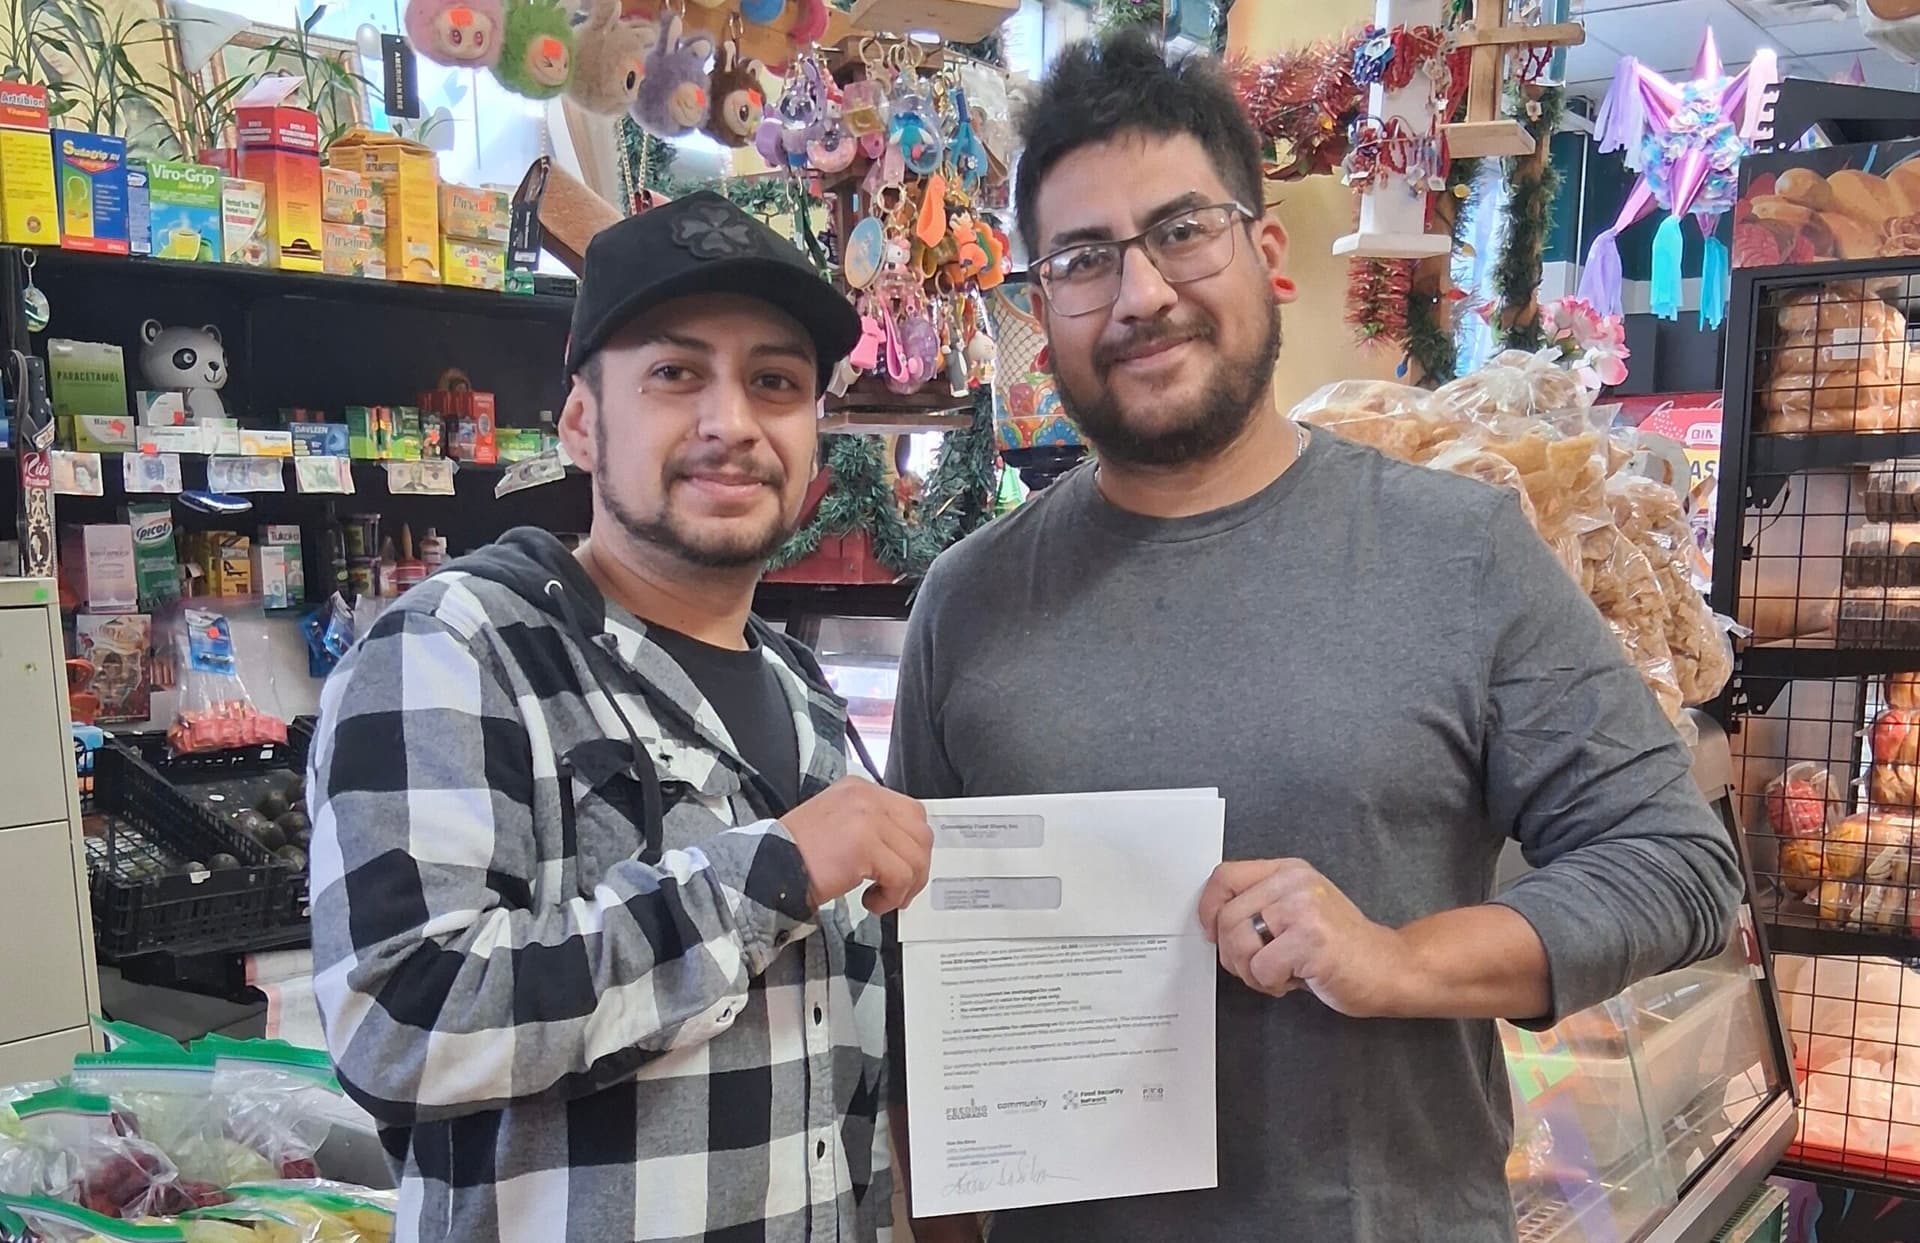
Washington University in St. Louis built the Food Pantry Desert Map with Ritenour and the WashU St. Louis Policy Initiative to track pantry locations across the region and identify access gaps. The project was designed to spot places where likely food insecurity and limited pantry access overlap, then flag where additional outreach or coordination is most needed. It was also shaped by the 2025 federal shutdown and SNAP disruption, a reminder that hunger systems need a plan before the next shock, not after.
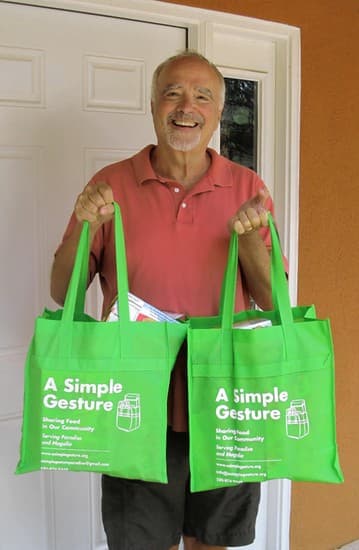
For A Simple Gesture, that is the same operational lesson that drives green-bag pickups. Route design is not just logistics, it is service delivery. If the team knows where pantry access is thinnest, where donor clusters are strongest, and where volunteers can realistically cover scheduled pickups, it can put resources in the places that move the most food with the least friction.
What the map is actually showing
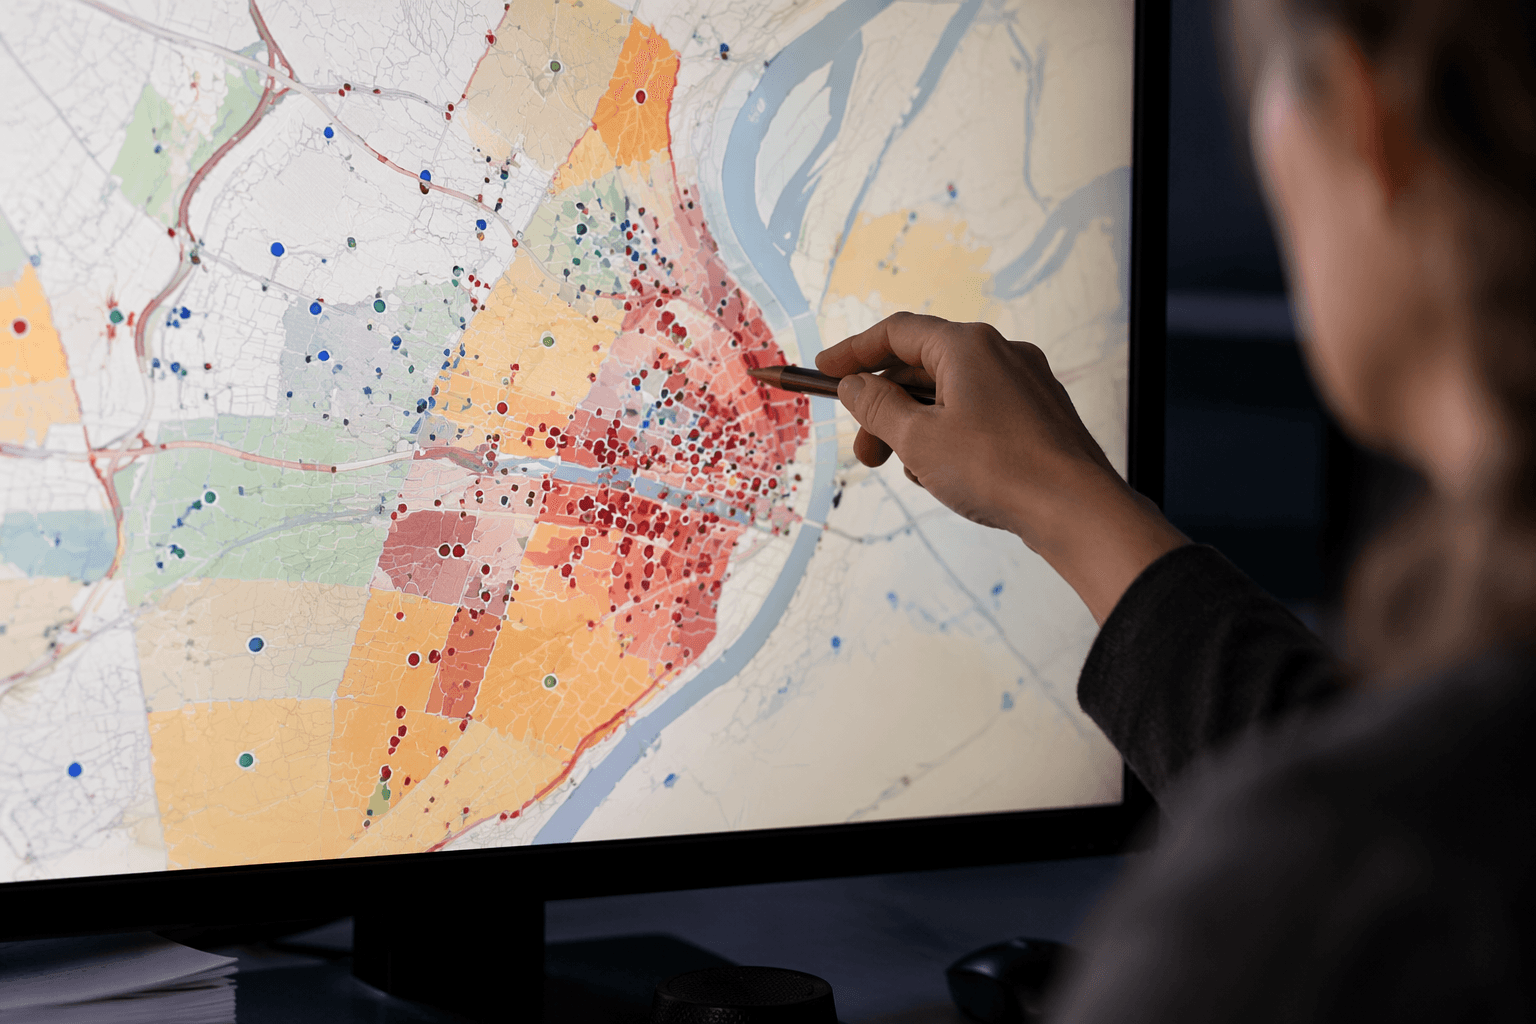
The Food Pantry Desert Map is not just a static pin map. It is a tract-level planning map and a four-tier planning summary built from an unmet pantry need measure. The related Missouri Food Pantry Planning Map describes its index as a normalized 0 to 100 planning measure that summarizes estimated unmet need and access conditions.
That matters because the map is trying to answer a different question than most service directories. A directory tells you whether a pantry exists. A planning map asks whether access exists in a usable form, with the right hours, staffing, inventory, and client policies to match actual need. WashU reporting notes that some pantries may be open only once a month or for two hours a week, which means location alone can seriously overstate coverage.
The model’s one-mile service radius is useful as a starting point, but only if staff treat it as a rough assumption, not a promise. In practice, service quality can vary neighborhood by neighborhood, and the best route on a spreadsheet may still miss households that are technically close but functionally cut off.
How hunger-relief teams can use it day to day
For a neighborhood food recovery nonprofit, the map is most useful when it gets folded into decisions that already happen every week. Volunteer recruitment, donor outreach, pickup scheduling, and pantry partnerships all become sharper when leaders can see where need is concentrated and where the current system is thin.
A practical expansion checklist looks like this:
- Start with tract-level need, not anecdote. Use a planning map to see where food insecurity and weak pantry access overlap.
- Layer in operating details. Hours, client limits, intake rules, food types, and staffing matter as much as the address.
- Test the one-mile assumption against real travel patterns. A neighborhood can be close on paper and still hard to reach in practice.
- Compare capacity, not just location. A high-volume pantry serving hundreds of families has a different role than a small site with limited stock.
- Match route growth to service gaps. Add pickup routes or volunteer coverage where the map shows unmet need, not where outreach is simply easiest.
- Revisit the map after shocks. Shutdowns, storms, and economic disruptions can change demand fast.
That approach fits A Simple Gesture’s own model. The organization says it has operated since 2015, rescuing edible food from businesses and delivering it to local nonprofits. It also says a $1 donation converts to more than $30 of food going to food banks and pantries, which makes every route decision more than a scheduling choice. The better the route planning, the more effectively that donation turns into food on shelves.
What the numbers say about the need
The case for planning this way is not limited to St. Louis. USDA Economic Research Service data show that 5.4% of U.S. households, or 7.2 million households, experienced very low food security at some point in 2024. Missouri’s food insecurity rate was about 13% for the 2022 to 2024 period, a level that keeps pressure on local networks even when national headlines move on.
The regional response already runs on scale. Operation Food Search says it distributes more than $32 million worth of food and necessities each year through more than 600 community partners across 24 Missouri and Illinois counties. That kind of network only works if each partner understands where it fits: which neighborhoods need pantry access, which need delivery, and which need a rapid surge response when benefits are delayed or disrupted.
Ritenour’s own experience shows how quickly pressure builds. Late-2025 local reporting said the pantry served more than 200 families in a single day during the SNAP crisis, including about 35 first-time visitors. That is the kind of surge that exposes weak spots in a service map immediately. If a pantry is suddenly the only visible option for families in a wider area, the issue is not just volume. It is whether the surrounding system has been planned well enough to absorb the demand.
The bigger lesson for food recovery teams
The Pantry Desert Map works because it treats geography as a management tool. It asks where the gaps are, who is already carrying the load, and whether the current network can actually reach the households it says it serves. That is the same discipline food-recovery groups need when they decide where to recruit volunteers, which streets to cover, and which partner agencies need backup.
In a field where every missed pickup means food left behind and every thin service area leaves a family with fewer options, the real value of mapping is not the map itself. It is the discipline it imposes on the next decision.
This article was produced by Prism’s automated news system from verified source data, official records, and press releases, then run through automated quality and moderation checks before publishing. The system is built and supervised by the people who set the standards it runs under. Read our full AI policy.
Did this article answer your question?