IAEA map tracks global spent nuclear fuel inventories by storage type
The IAEA’s new map turns 448,000 tonnes of used fuel into a storage-by-storage baseline, showing where pools, casks and reprocessing pressure are building first.
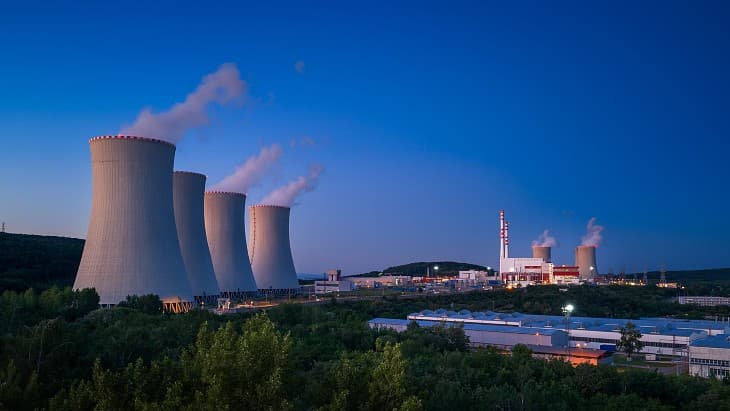
The IAEA has turned spent fuel from a global total into something operators can read at a glance: a country-by-country map of where used fuel sits, how it is stored and how much has already been reprocessed. The new interactive view, built into the second edition of the agency’s Global Spent Nuclear Fuel Inventory, puts the world’s 448,000 tonnes of heavy metal from power reactors into operational terms, not just accounting terms.
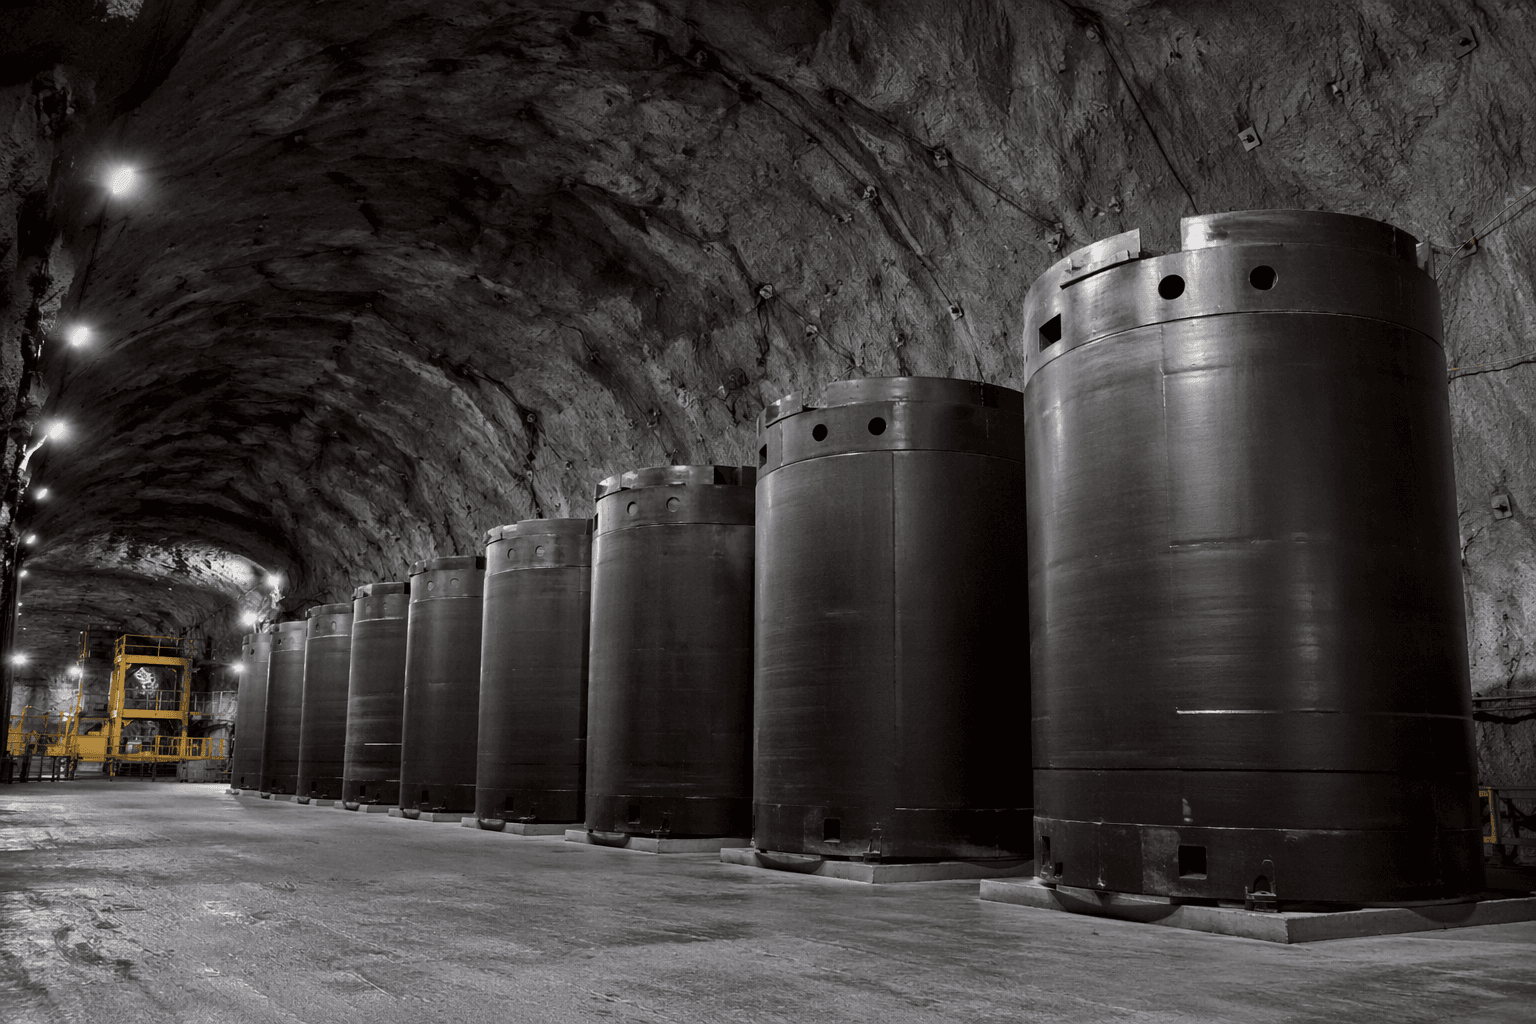
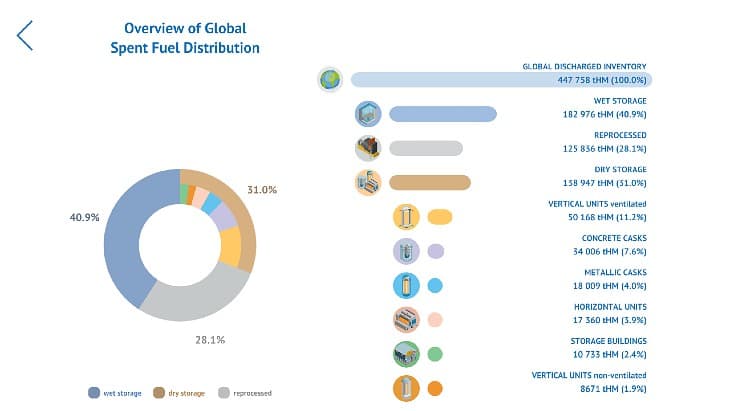
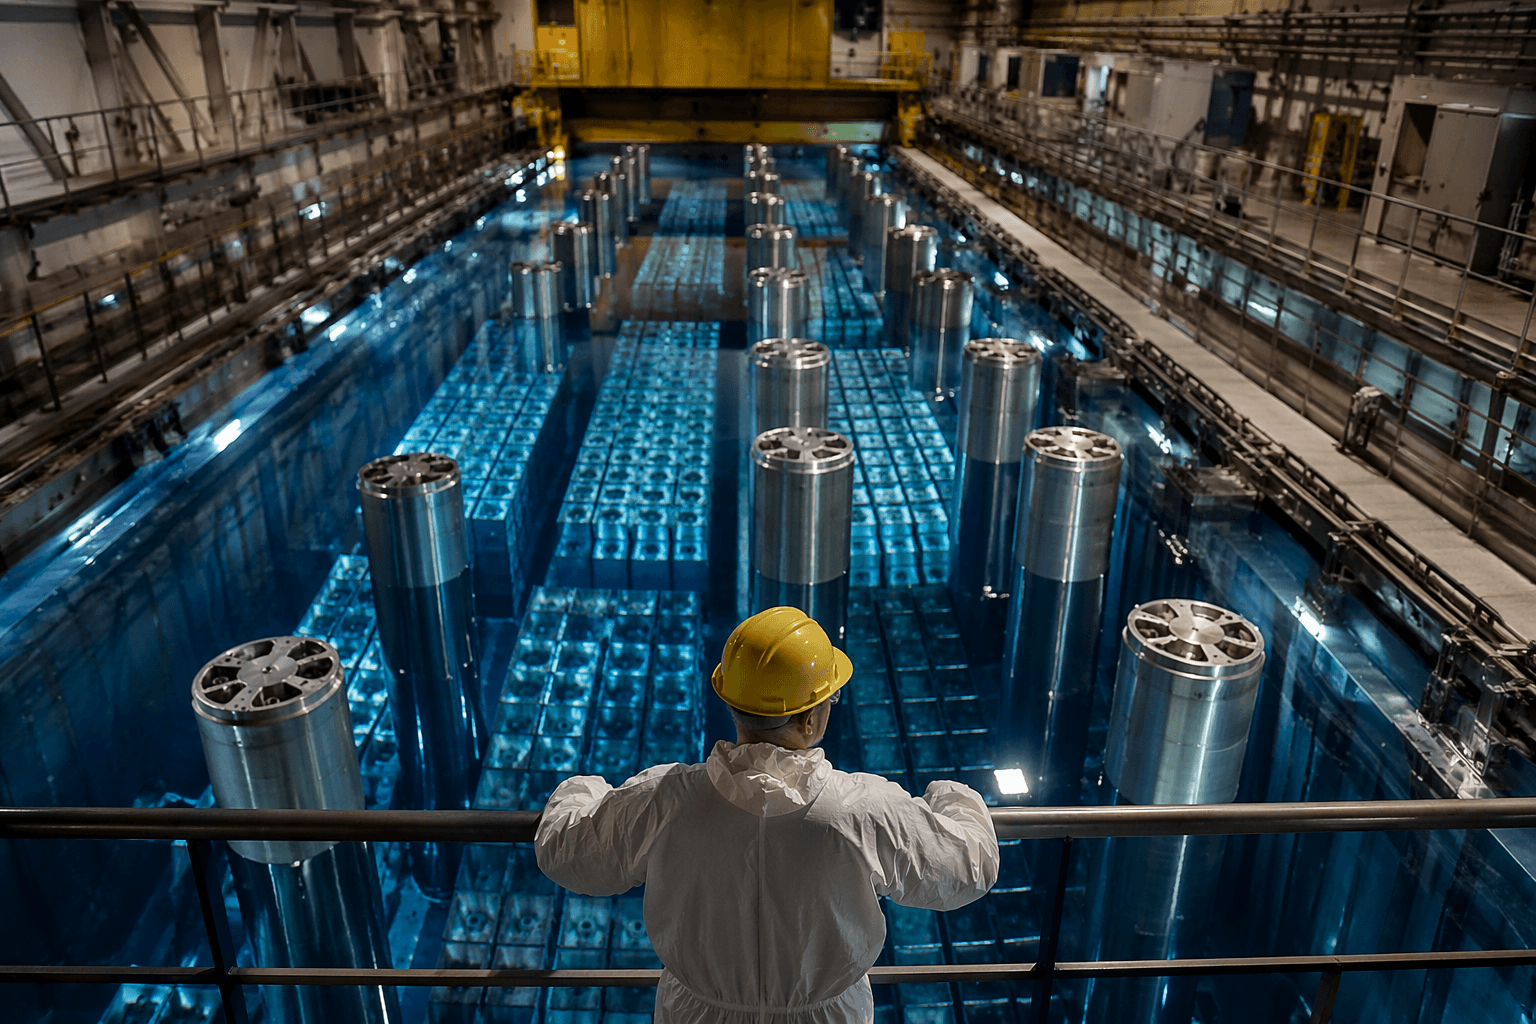
The headline split is what changes the conversation. About 41 percent of used fuel is in wet storage, mostly pools and centralized cooling pools, while about 31 percent is in dry storage, including casks, buildings and modular systems. Roughly 126,500 tHM has already been reprocessed. That matters because wet storage, dry storage and reprocessing are not interchangeable back end options. Each one carries different engineering demands, licensing timelines and cost curves, and the IAEA is now showing where those pathways are already dominant.
For reactor operators, the map is a reminder that discharge is only the start of the work. Fuel leaves the core and enters a management chain that can stretch for decades, or longer, while countries decide whether material will be recycled, sent to final disposal or kept in storage. The agency says many spent fuel storage systems may need to be maintained for more than 100 years because progress on deep geological disposal remains slow. That makes storage capacity, aging management and cask availability part of routine fleet planning, not a distant waste issue.
For waste planners and regulators, the new format is more useful than a static spreadsheet because it lets users compare countries, regions and storage types in one place. The inventory is based on the latest reports submitted for the 2025 Joint Convention review meeting, supplemented by other public sources, and it uses rounded figures expressed in tons of heavy metal. The agency’s broader spent fuel management guidance treats this as the nuclear fuel cycle’s back end, where safe storage, recycling and eventual disposal all compete for time and money.
The map arrives as governments and utilities are still working through the same question that has shadowed every reactor build: what happens after discharge? At the Joint Convention’s Eighth Review Meeting in Vienna, more than 1,000 delegates from 77 Contracting Parties and one Signatory State, Lebanon, focused on ageing management, staffing and long-term waste responsibilities. The new inventory gives that debate a sharper baseline. It shows that the spent fuel problem is not abstract, and not evenly spread. It is sitting in pools, in casks and in buildings, waiting for the next decision to move it.
This article was produced by Prism’s automated news system from verified source data, official records, and press releases, then run through automated quality and moderation checks before publishing. The system is built and supervised by the people who set the standards it runs under. Read our full AI policy.
Did this article answer your question?