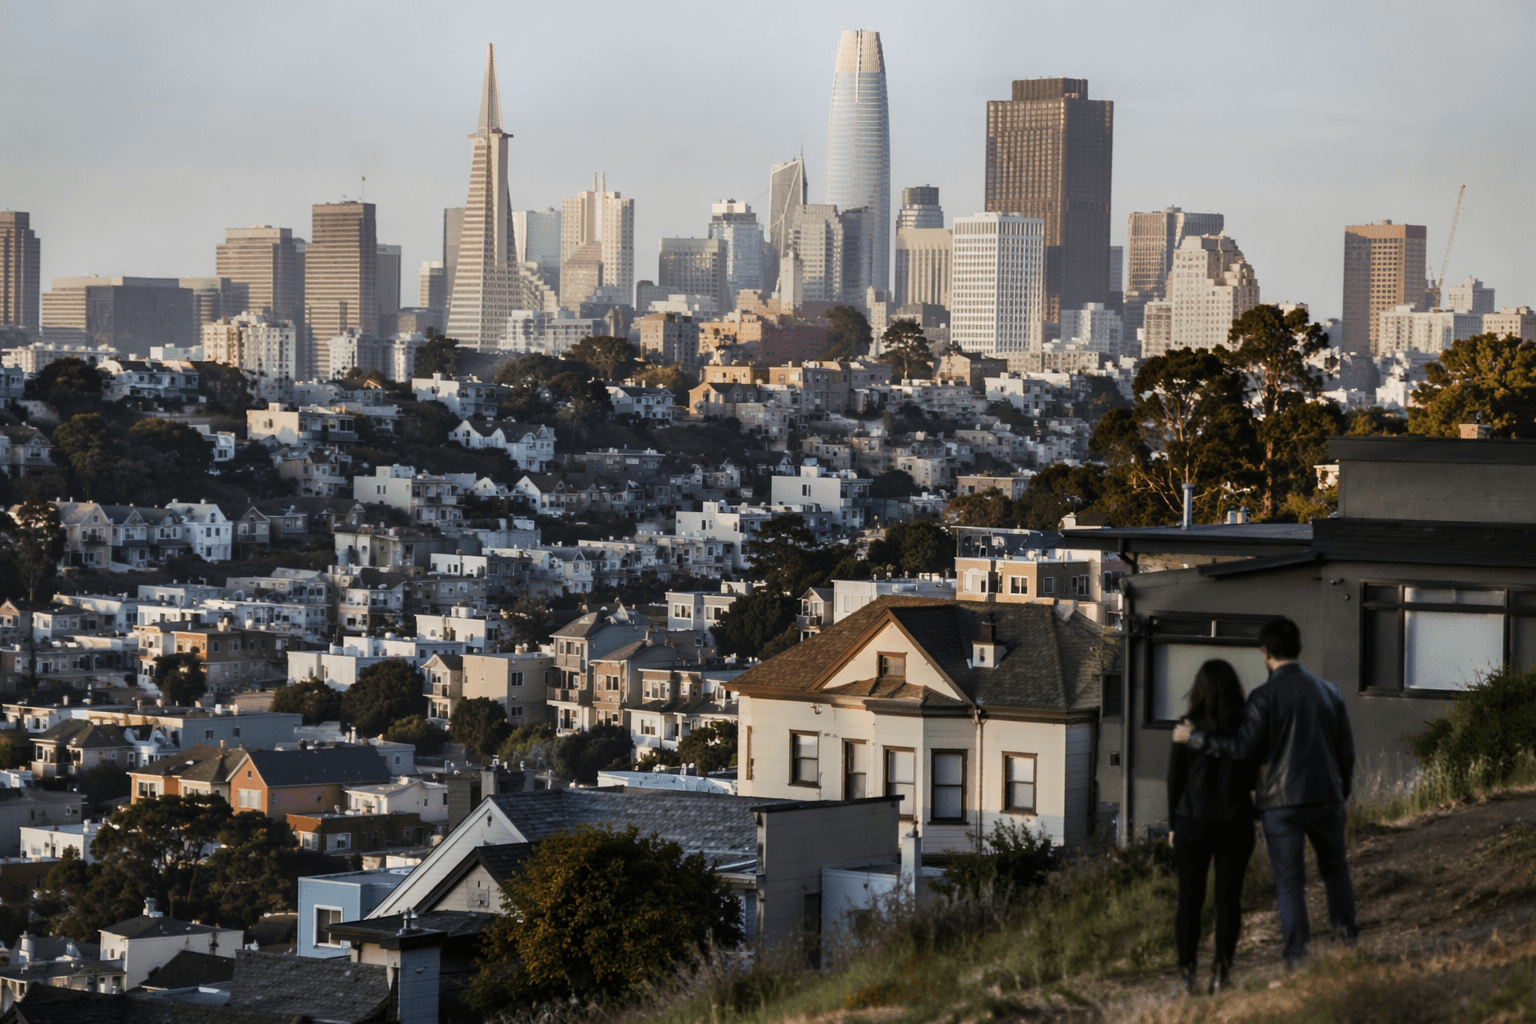
San Francisco home prices soar 270% as regulations fuel scarcity
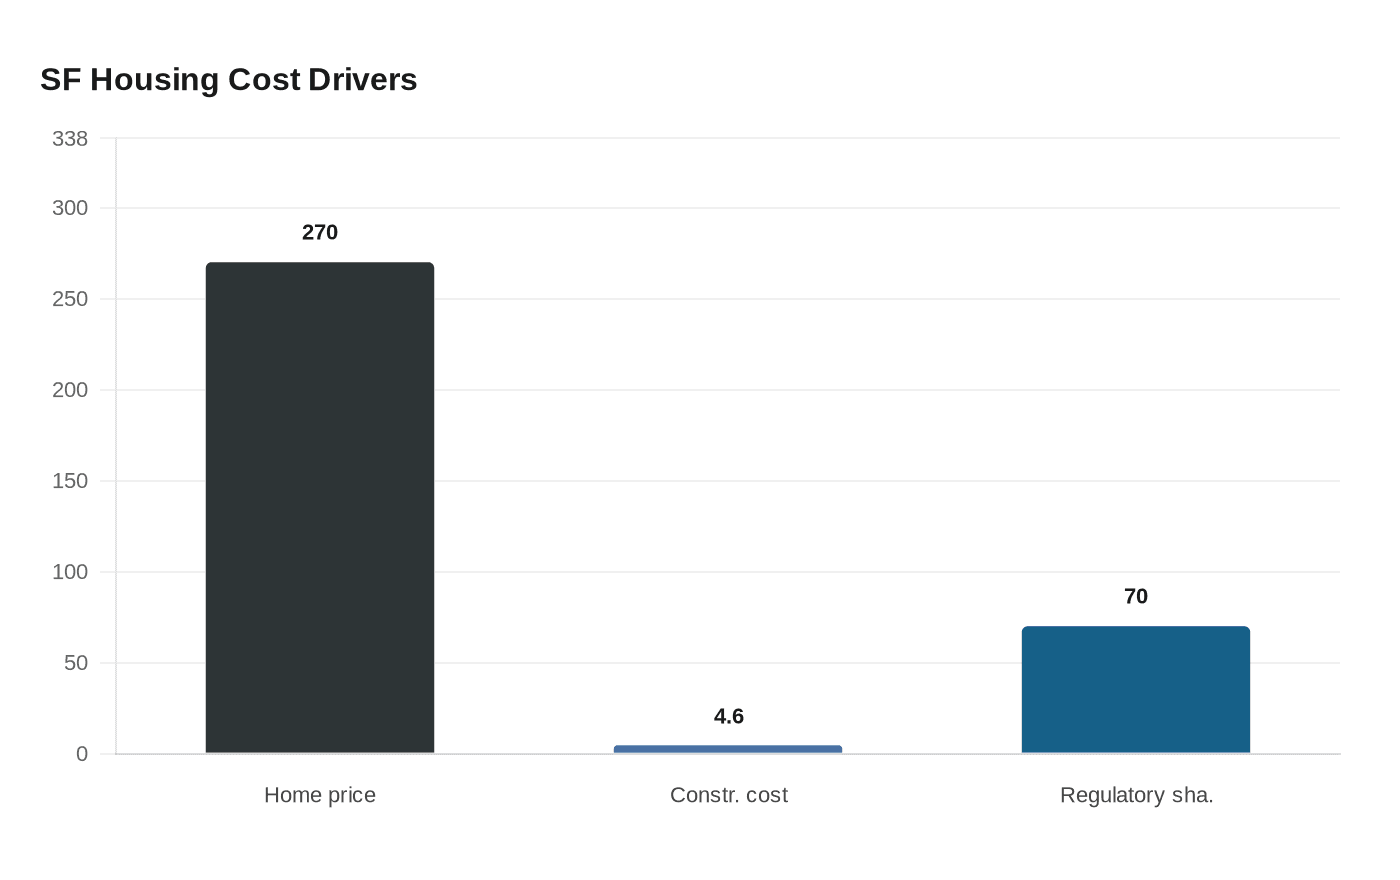
San Francisco home prices climbed 270% since 1970 while construction costs rose 4.6%, leaving zoning and permits to explain most of the gap.
In San Francisco, the price of a home has risen 270% since 1970 while construction costs climbed just 4.6%, an analysis by Jason Ward, Rebecca Diamond, Tim McQuade and Franklin Qian found. The gap is not a mystery of materials or labor: the study says roughly 70% of today’s price is tied to regulatory approval rather than the physical structure, turning zoning, permits and anti-development policy into the real cost driver for renters, first-time buyers and families trying to stay in the city.
California’s housing department has said San Francisco has the longest timelines and some of the highest procedural hurdles in the state for advancing housing projects to construction. Its first-of-its-kind Housing Policy and Practice Review identified barriers in planning review, CEQA implementation, the local appeals process and post-entitlement permitting, and it required the city to reform its housing approvals ecosystem at all income levels. In October 2023, Gavin Newsom’s administration said the review was built around decades of costly building delays and a housing pipeline that still falls short of unmet needs.
The cost burden is visible across California, but San Francisco sits at the sharp end. RAND found that building multifamily housing in California cost 2.3 times as much as in Texas and 1.5 times as much as in Colorado, while projects took more than 22 months longer than in Texas on average. It also found average municipal impact and development fees of $29,000 per unit in California, compared with less than $1,000 in Texas, and said Bay Area apartment costs were about three times the Texas average. Those numbers shape what gets built, where it gets built and how much scarcity is passed on to tenants.

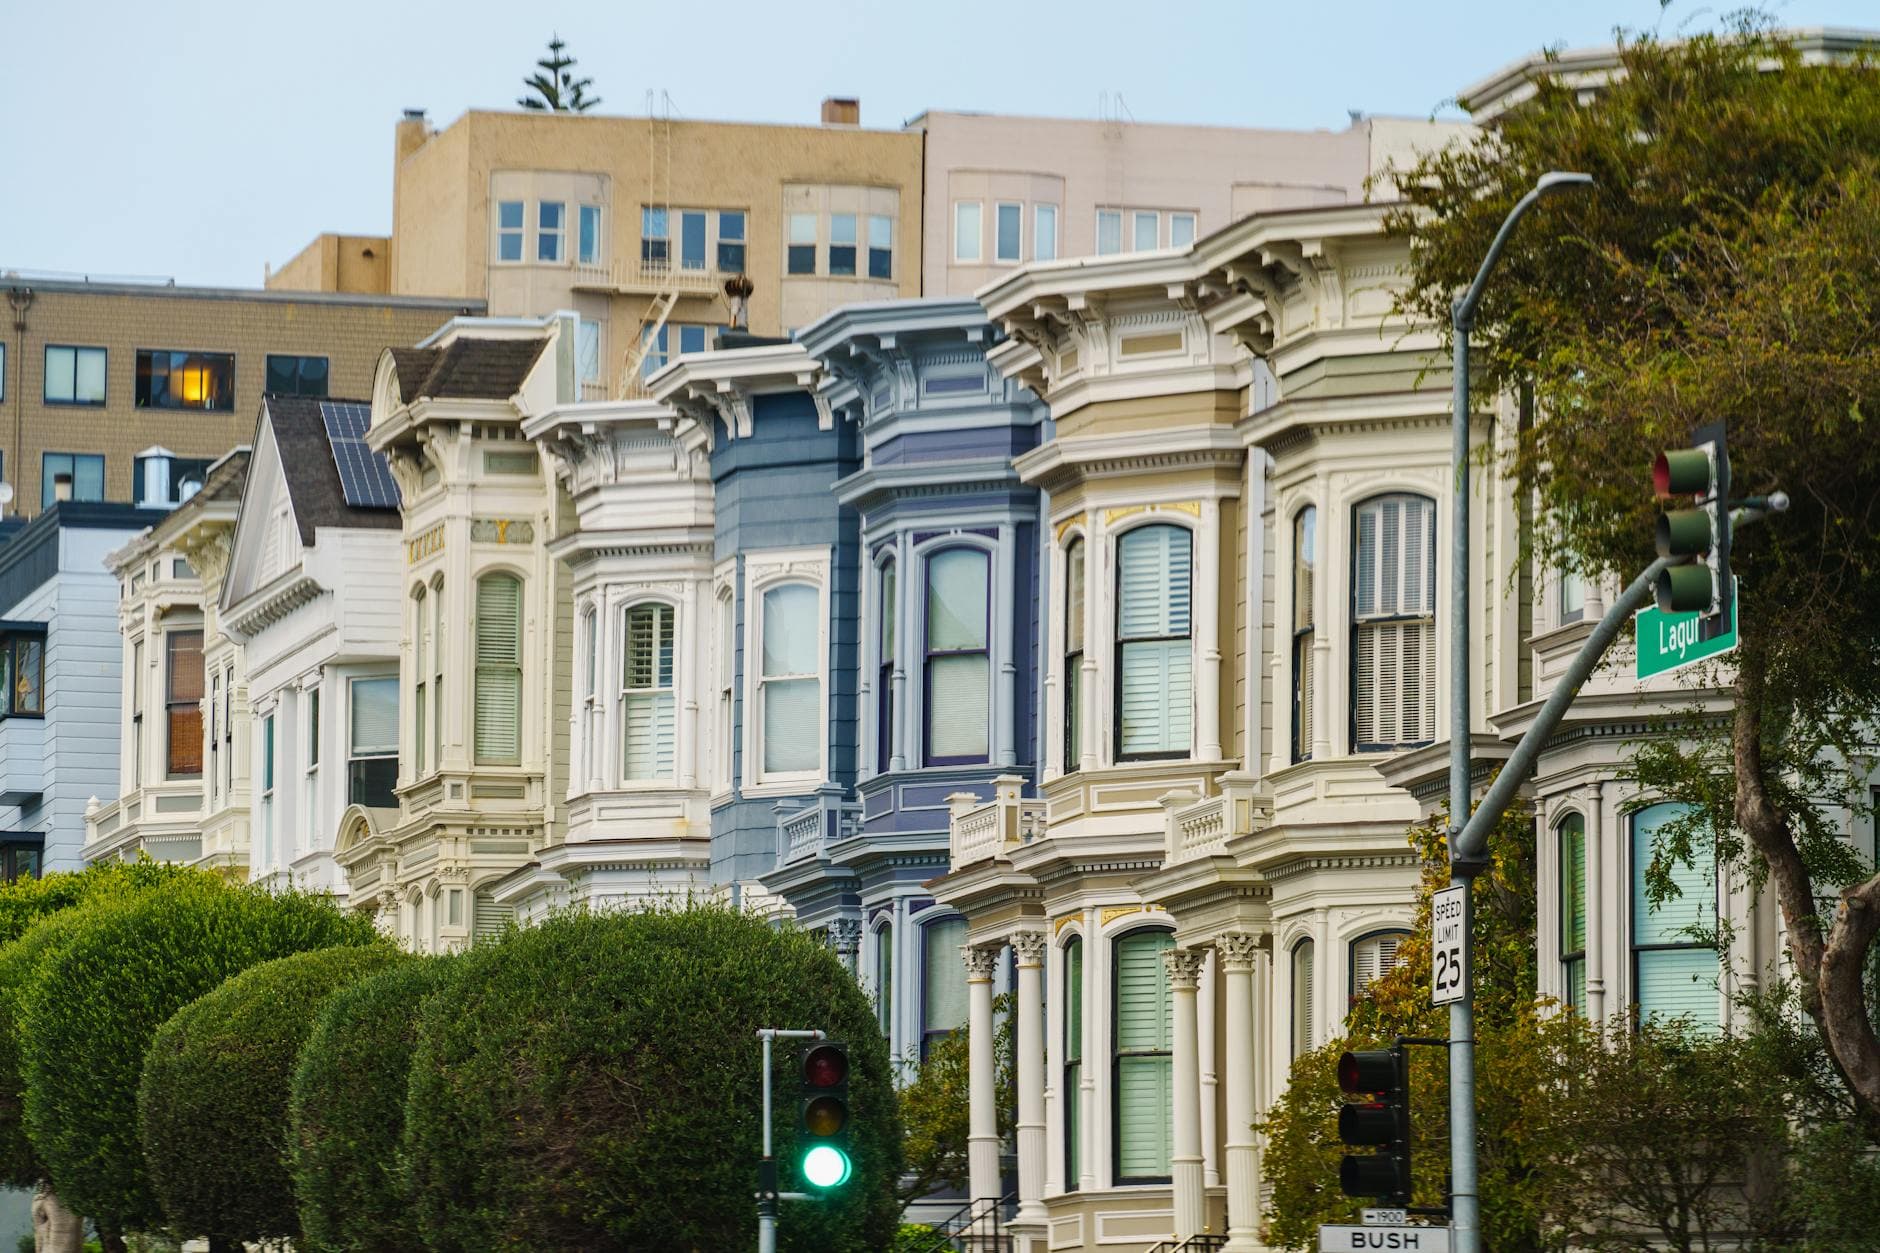
San Francisco’s own planning materials say most housing built in recent decades was concentrated in the eastern neighborhoods, while the northern and western parts of the city were long zoned primarily for single-family development. City planners tied that pattern to economic and racial segregation, and the Family Zoning Plan was written to unwind some of it. The Planning Commission approved the plan 4-3 in September 2025 after about eight to 10 hours of public comment and meeting time, Mayor Daniel Lurie signed it on December 12, 2025, and it took effect January 12, 2026. The city had to approve a compliant rezoning plan by January 31, 2026 to meet state obligations.
San Francisco’s housing fight also has a warning from its own history. A Stanford Graduate School of Business and American Economic Review study found that a 1994 rent-control change reduced renters’ mobility by 20% and cut rental housing supply by 15%, as landlords sold to owner-occupants or redeveloped buildings. The lesson is plain: policy can protect one group in the short run and still shrink supply over time. In San Francisco, every delay, appeal and zoning restriction leaves a higher price tag for the next household that needs a place to live.
Know something we missed? Have a correction or additional information?
Submit a Tip