17 Essential Market Data Sources SEO Teams Should Track for 2026
Tracking the right market data turns SEO reporting from a vanity exercise into a client-renewal machine — here are the 17 sources that connect your delivery to CFO conversations.

Most SEO agencies lose clients not because the rankings dropped, but because nobody connected the rankings to the money. A client whose organic traffic held steady during a quarter when retail media captured 20 percentage points of incremental ad spend doesn't feel like they're winning. They feel like they're standing still. That disconnect is a retention problem, and the fix is context.
The Gradient Group, a marketing analytics and strategy consultancy, built a catalog of 17 high-value data reports designed to help SEO practitioners and agency leaders do exactly that: map internal performance data to external market signals so every QBR, every pricing conversation, and every upsell lands with evidence behind it. Think of these not as a reading list, but as the substrate for a monthly executive dashboard that agencies can productize as a premium reporting add-on. Each report enables a specific decision. Here's how to use them.
Macro Advertising & Spend Intelligence
1. IAB/PwC Internet Advertising Revenue Report
The gold standard for U.S. digital ad revenue tracking, this free annual report released each April surveys companies representing over 86% of U.S. internet ad revenue, meaning its figures are based on actual, verified spending, not estimates. Format breakdowns show capital flowing from established channels like traditional search into high-growth areas like social video, connected TV, and retail media. When a client asks why their organic-only strategy needs a rethink, this is the slide you build it on.
2. MAGNA Global Ad Forecast (IPG Mediabrands)
Published twice yearly, in June and December, MAGNA is the forward-looking counterpart to the IAB's backward look. The December update gives you fresh data for annual planning; the June update enables mid-year course corrections. If MAGNA forecasts a 20% surge in retail media while projecting only 5% growth in search, that is a signal that commercial intent is migrating and a direct argument for adding shopping feed management to your service catalog.
3. Five-Year Digital Media Outlook
Released annually each July with a paid subscription and free overview highlights, this forecast spans 53 countries and five years, incorporating regulatory changes, technology adoption curves, and demographic shifts. It is especially useful for agencies building a case to expand into new international SEO markets, because it distinguishes between markets with genuinely growing digital infrastructure and those where projections rest on shakier assumptions.
Platform Earnings: Where the Real Signals Live
4. Alphabet/Google Quarterly Earnings
Released four times a year (Q1 in late April, Q2 in late July, Q3 in late October, Q4 in late January or early February), these free reports reveal the strategic priorities and emerging vulnerabilities of the single most important platform in search. YouTube ad revenue growth, Search revenue deceleration, and commentary on AI Mode investment all land here first, months before they appear in secondary analysis.
5. Amazon Advertising Revenue Reports
For years, Amazon's advertising business has grown faster than its AWS cloud unit, a fact that tells you precisely where brands are investing to capture customers at the point of purchase. Tracking the year-over-year ad revenue growth rate gives agencies a defensible financial argument for investing client resources in Amazon SEO, enhanced content, and sponsored placement strategies before the opportunity saturates.
6. Pinterest Quarterly Earnings
Pinterest's monthly active user growth by region reveals geographic patterns in visual search adoption, often previewing trends that surface across other platforms later. Average revenue per user by region adds a commercial layer: it tells you where visual discovery has already converted into actual purchase behavior, which is where a visual SEO investment is easiest to monetize.
Global Connectivity and Audience Behavior
7. We Are Social / Hootsuite Global Digital Report
Published annually, this is the definitive guide to global digital behavior: social platform usage, time spent, and shifting discovery patterns worldwide. When client traffic migrates away from websites toward platforms, this report provides the data to explain why and to justify content formats and distribution strategies that follow the audience.
8. ITU Global Connectivity Report
The International Telecommunication Union, a specialized UN agency, publishes connectivity and broadband affordability data that is indispensable for sizing international SEO opportunity. The most actionable metric is broadband affordability: when the cost of a basic internet plan in a developing country falls below 2% of average monthly income, that market historically enters rapid digital adoption. Agencies with international clients should map this report to their content investment roadmap.
9. Sandvine Global Internet Phenomena Report
Based on ISP-level traffic data from Sandvine's partner networks, this report tracks bandwidth usage by application and consistently shows that video accounts for 50 to 60% of all internet traffic. That single statistic justifies video SEO as a strategic priority in a way that no internal performance data can match. It also provides the infrastructure-level "why" behind the YouTube revenue growth visible in Alphabet's quarterly earnings.
Privacy and Regulatory Intelligence
10. IAPP-EY Annual Privacy Governance Report
Released each January and available free with registration, this report translates privacy regulation into business outcomes that finance and legal stakeholders understand. As targeting options narrow and measurement assumptions shift, agencies need a source that frames privacy not as compliance overhead but as a factor reshaping how audiences are built and measured. This is that source.
Search and Query Intelligence
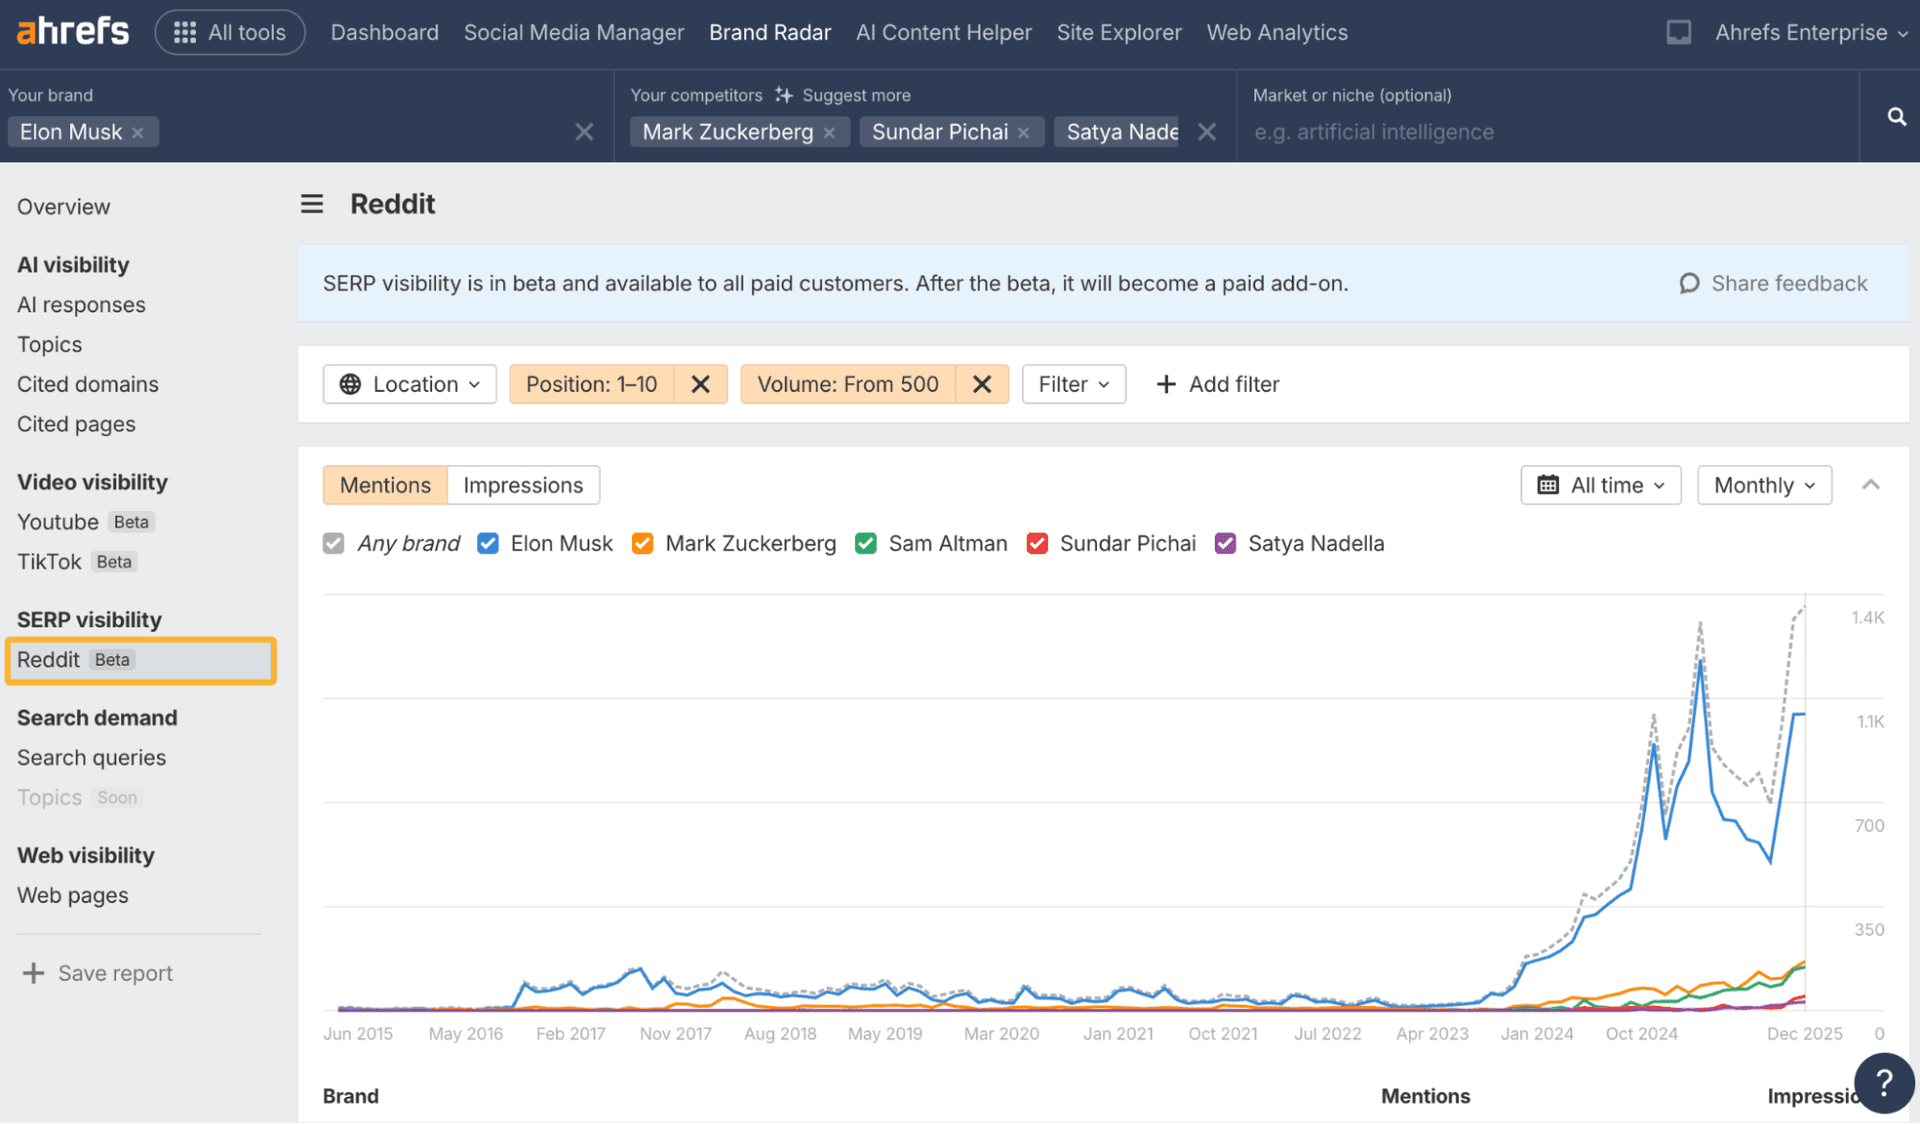
11. Google Trends
Continuous and free, Google Trends surfaces demand signals before they appear in rank-tracking tools. It enables proactive content investment: you can identify queries gaining velocity in adjacent categories, build a business case for new content clusters, and present that case to clients with a data visual rather than an opinion.
12. Google Search Console Aggregated Performance Data
The aggregated query and impression reports inside Search Console remain the most direct view of how algorithmic and behavioral changes affect a specific property. Declining impressions on short-tail queries, rising CTR on informational terms, or sudden position shifts all tell a story that must be read alongside external market data to carry weight in client conversations. This is the internal telemetry that makes external benchmarking meaningful.
Retail Media Networks
13. Amazon Ads Retail Media Reports
For agencies serving ecommerce clients, Amazon's advertising data tracks the migration of commerce budgets at the platform level. Paired with quarterly earnings data, these reports build the business case for product feed management and sponsored content as SEO-adjacent services that belong inside the agency's retainer, not outside it.
14. Walmart Connect Retail Media Reports
Walmart Connect rounds out the retail media picture beyond Amazon. As retail media budgets expand into multi-retailer environments, Walmart Connect data helps agencies identify white-space opportunities for clients not yet running on the platform, turning a gap analysis into a pitch for new work.
Technology Adoption and Procurement
15. Gartner Hype Cycle for Digital Marketing
For B2B-focused agency teams, Gartner's annual technology adoption and procurement research maps enterprise buying cycles and budget windows. It identifies which emerging capabilities, such as GEO and AEO readiness packages, are moving from experimentation into mainstream procurement. Timing a new service launch to align with the Gartner maturity curve is the difference between being an early mover and being behind the market.
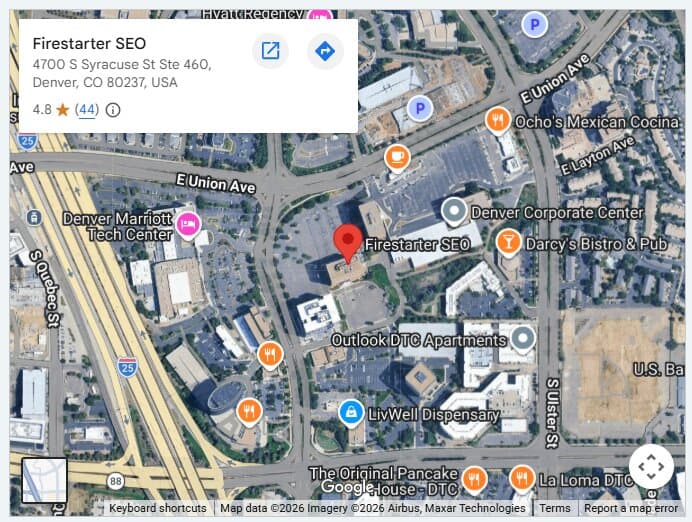
Local Search Intelligence
16. BrightLocal Local Consumer Review Survey
Published annually, this survey tracks how consumer behavior around online reviews evolves. Review recency and volume are core ranking signals for local search, and this report provides the third-party evidence needed to justify reputation management as a margin-positive service, not a loss leader bundled into a local SEO package.
17. BrightLocal Local Search Ranking Factors
Also published annually, this is the most granular public analysis of what drives local pack visibility, including the primacy of Google Business Profile category selection, review signals, and the growing presence of AI Overviews for local queries. For agencies pitching multi-location franchise programs or local GEO packages, this report is the foundation for every competitive audit and every service-line expansion conversation.
The agencies that use these 17 sources well do not present them as data they found. They present them as evidence for decisions they are already recommending. That is the shift: from SEO reporting as proof of activity to SEO reporting as a client-renewal system that ties every deliverable to a market movement the client's CFO already cares about.
This article was produced by Prism’s automated news system from verified source data, official records, and press releases, then run through automated quality and moderation checks before publishing. The system is built and supervised by the people who set the standards it runs under. Read our full AI policy.
Did this article answer your question?