Monday.com Gantt chart guide turns business plans into execution timelines
A Gantt chart can reveal whether a business plan is real or just presentable. monday.com uses that lesson to tie strategy, ownership, and deadlines into one execution timeline.

When strategy hits the calendar
Miss one dependency and the whole plan starts to wobble: launches slip, teams duplicate work, and nobody can say who was supposed to move first. That is the problem monday.com is trying to solve with its Gantt chart business-plan guide, which treats planning as an execution test, not a presentation exercise.
The core idea is simple but unforgiving. A business plan only works if people can see milestones, dependencies, and timelines in one place, then follow the sequence without guessing. monday.com’s guide turns that into a practical workflow through monday work management, so the plan stays visible after the meeting ends and does not collapse into a static spreadsheet or a slide deck that nobody opens again.
Why the Gantt chart still matters
The Gantt chart is old, but the underlying management problem has not changed. Henry L. Gantt developed the chart in the 1910s, and the Project Management Institute says it gained prominence in 1917 through production scheduling at the Frankford Arsenal. PMI also points to its later use on projects as large as the Hoover Dam and the interstate highway network.
That history matters because monday.com is repackaging a century-old tool for a modern SaaS company that runs on product releases, customer commitments, and cross-functional timing. In other words, the chart is not about decorating a plan. It is about making sure a plan can survive real work, where engineering dependencies affect product launches, launch timing affects sales motions, and sales promises feed back into operations.
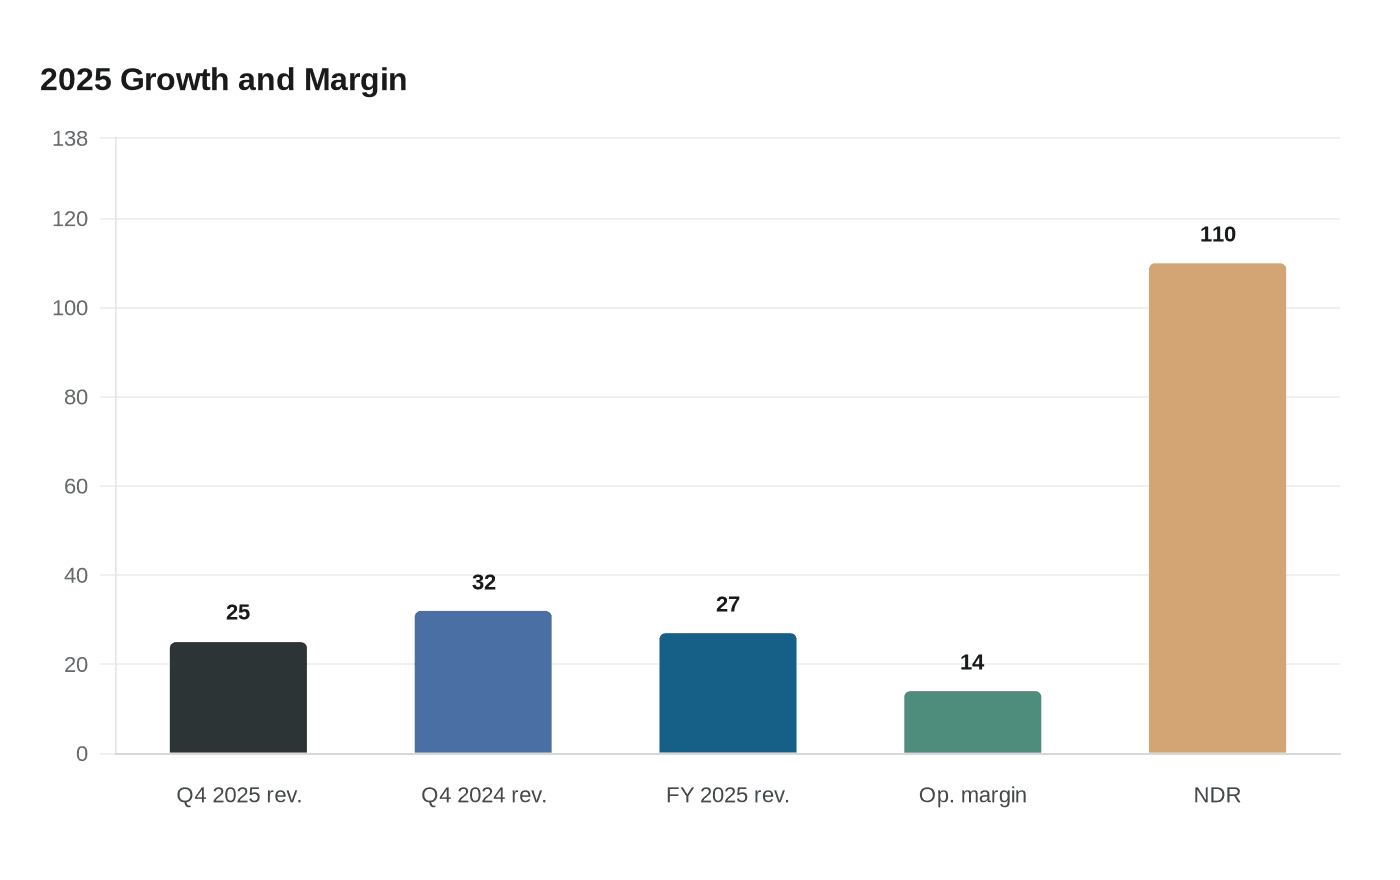
For a company like monday.com, the lesson is especially relevant. The business now says it serves more than 250,000 customers worldwide, reached $1 billion in annual recurring revenue in 2024, and reported fourth-quarter 2025 revenue of $333.9 million, up 25% year over year. At that scale, vague planning becomes expensive fast. One missed handoff can cascade into slower rollouts, confused teams, and customer-facing delays.
What monday.com is really saying to its own workforce
The article’s deeper message is not just about project management software. It is a reminder that monday.com’s own growth depends on turning strategy into visible, coordinated work across departments. Product managers are being asked to make roadmap choices with clear timing and dependencies. Engineers are being asked to expose upstream blockers before they become launch problems. Sales and operations teams are being pushed to connect campaigns, launches, and account initiatives to a calendar instead of to optimism.
That is the point of a Work OS in practice. monday.com is not only selling planning software; it is modeling how a company keeps strategic intent alive once execution begins. The guide’s framing makes that hard to miss: if the timeline is not shared, the plan is not real enough to manage.
There is also a labor reality here that employees will recognize immediately. Fuzzy accountability is not an abstract management flaw. It is the reason two teams sometimes do the same work twice, or why a launch date gets announced before the handoffs are in place. A Gantt chart does not fix weak leadership, but it does make the gaps visible.
What the tool actually gives you
monday.com’s own product setup gives the guide its practical edge. The Gantt chart view and widget are available on the Standard plan and up, while milestone and critical path features are reserved for Pro and Enterprise plans. That matters because the company is effectively separating basic timeline visibility from more advanced sequencing and risk management.
The dependency settings are just as telling. In strict mode, dates can shift automatically when a dependent task moves. In no action mode, the chart still shows the relationship without forcing the schedule to move. That distinction is useful for teams that want visibility without automation, and it also shows how much planning discipline the software assumes. If you do not define dependencies clearly, the chart cannot protect you from bad sequencing.
For teams inside monday.com, that becomes a useful operating standard. A product launch, for example, should show how design completion affects engineering work, how engineering affects QA, and how QA affects enablement. Sales rollout plans should show when collateral, training, and account outreach depend on the product being ready. The chart becomes less of a reporting artifact and more of a coordination layer.
The seven-step build and the execution habit it reinforces
monday.com says the guide lays out a seven-step build, and the significance of that structure is that it turns planning into a repeatable habit. The value is not in the number of steps itself. It is in the discipline of moving from a business goal to the work that makes it possible, then assigning timing and dependencies so the sequence is visible to everyone involved.
That is where the company’s product story and its workplace story intersect. monday.com’s platform is designed around flexible coordination, and the Gantt chart guide uses that flexibility to show what operational belief looks like. If a plan cannot be traced from goal to milestone to dependency to due date, it is still mostly a concept. If it can, people can actually manage it.
The catch: Gantt charts can create false certainty
PMI’s caution is the right counterweight to monday.com’s optimism. Gantt charts can imply a level of precision that long-range planning does not deserve, especially when the horizon stretches out and conditions can change. PMI recommends ranged dates for longer-term planning and argues that planning events are often most useful as collaboration and dependency-management moments, not as one-time rituals.
That warning is worth taking seriously inside any scaling SaaS business. Exact dates can become false promises if leadership confuses visibility with certainty. The better use of a Gantt chart is to surface tradeoffs early, not to pretend the future is fixed.
For monday.com, that balance is the real story. The company went public on Nasdaq on June 10, 2021, and as a listed business with growing enterprise revenue, it has to prove that planning discipline exists beyond the pitch. The numbers matter, the product features matter, but the larger lesson matters more: a business plan only has value when people know who owns what, by when, and what breaks if the timing slips.
That is why the Gantt chart still earns its place. It turns ambition into an execution timeline, and it makes accountability hard to hide.
Know something we missed? Have a correction or additional information?
Submit a Tip